How to track statistics and link a graph to a post
about 10 minutes
A statistic records a result over time. A manager can use its graph to check whether output rises or falls. This guide creates a weekly graph and then shows how to link an available graph to a post.
Before you start
Have a post ready on the board. The example uses a post named “Order fulfillment” and links the available graph “Weekly packed units.”
Step 1 — Open statistics
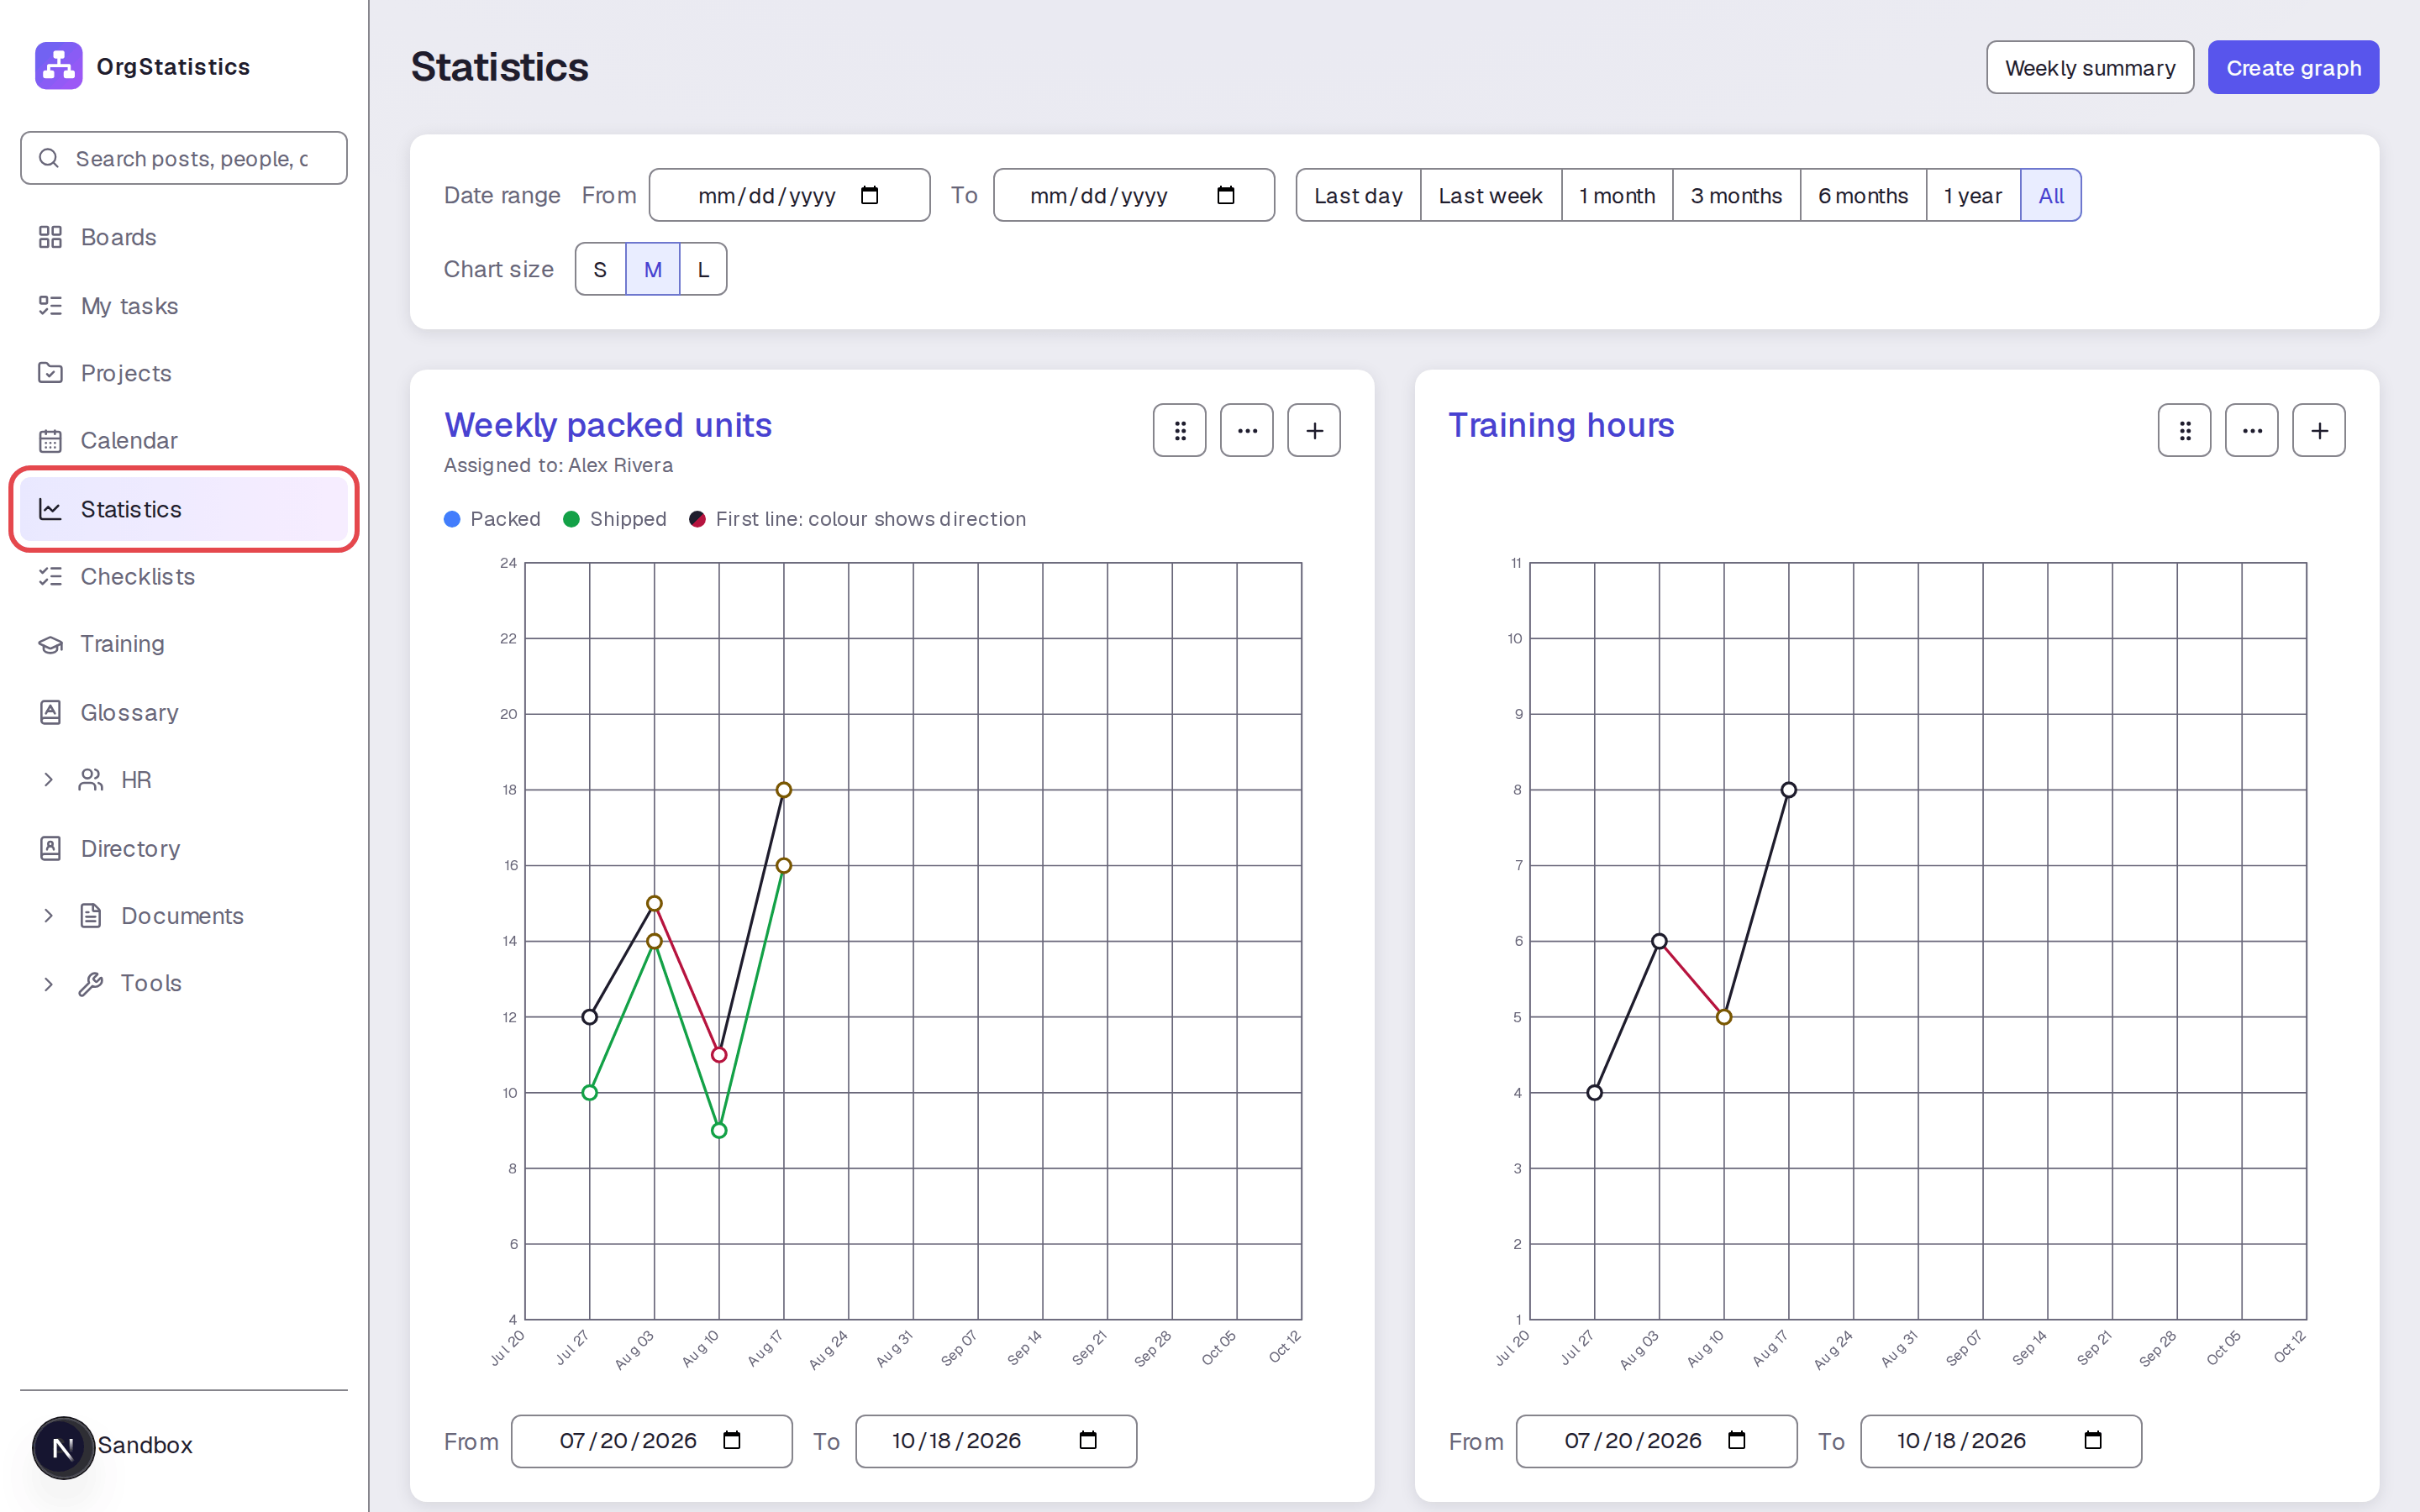
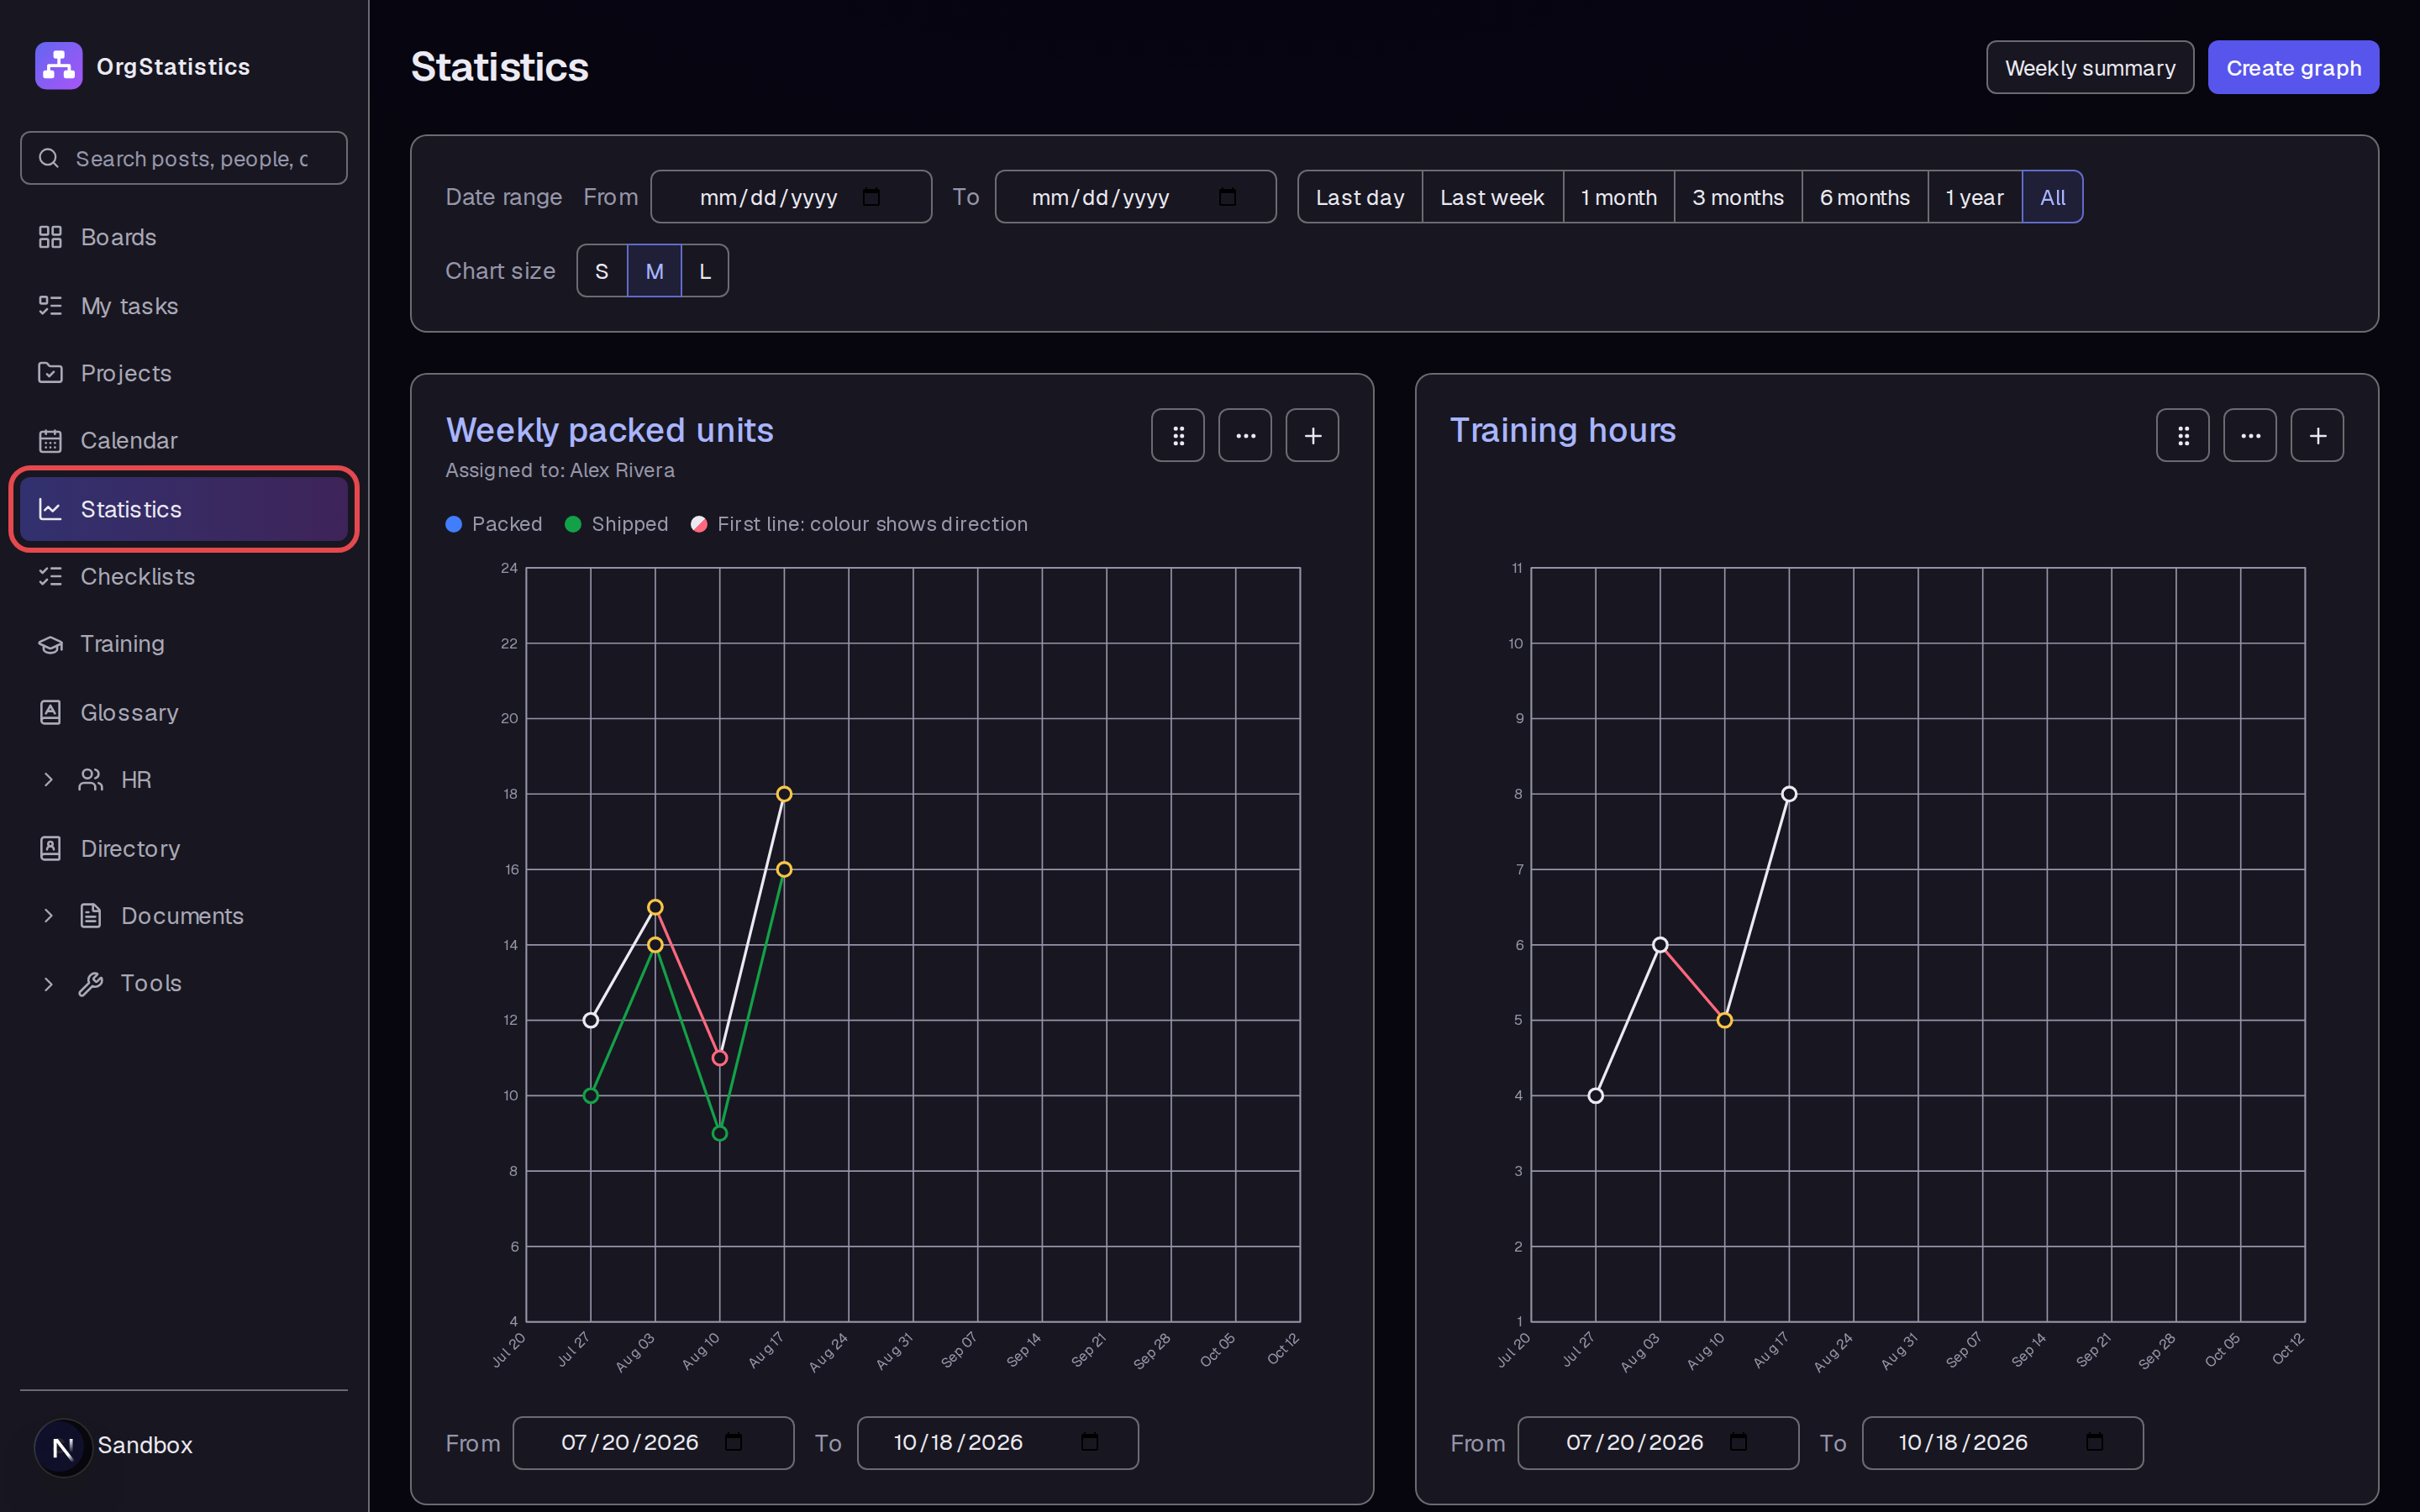
Select Statistics in the left menu. The page shows graphs and date controls.
Step 2 — Set up a weekly graph
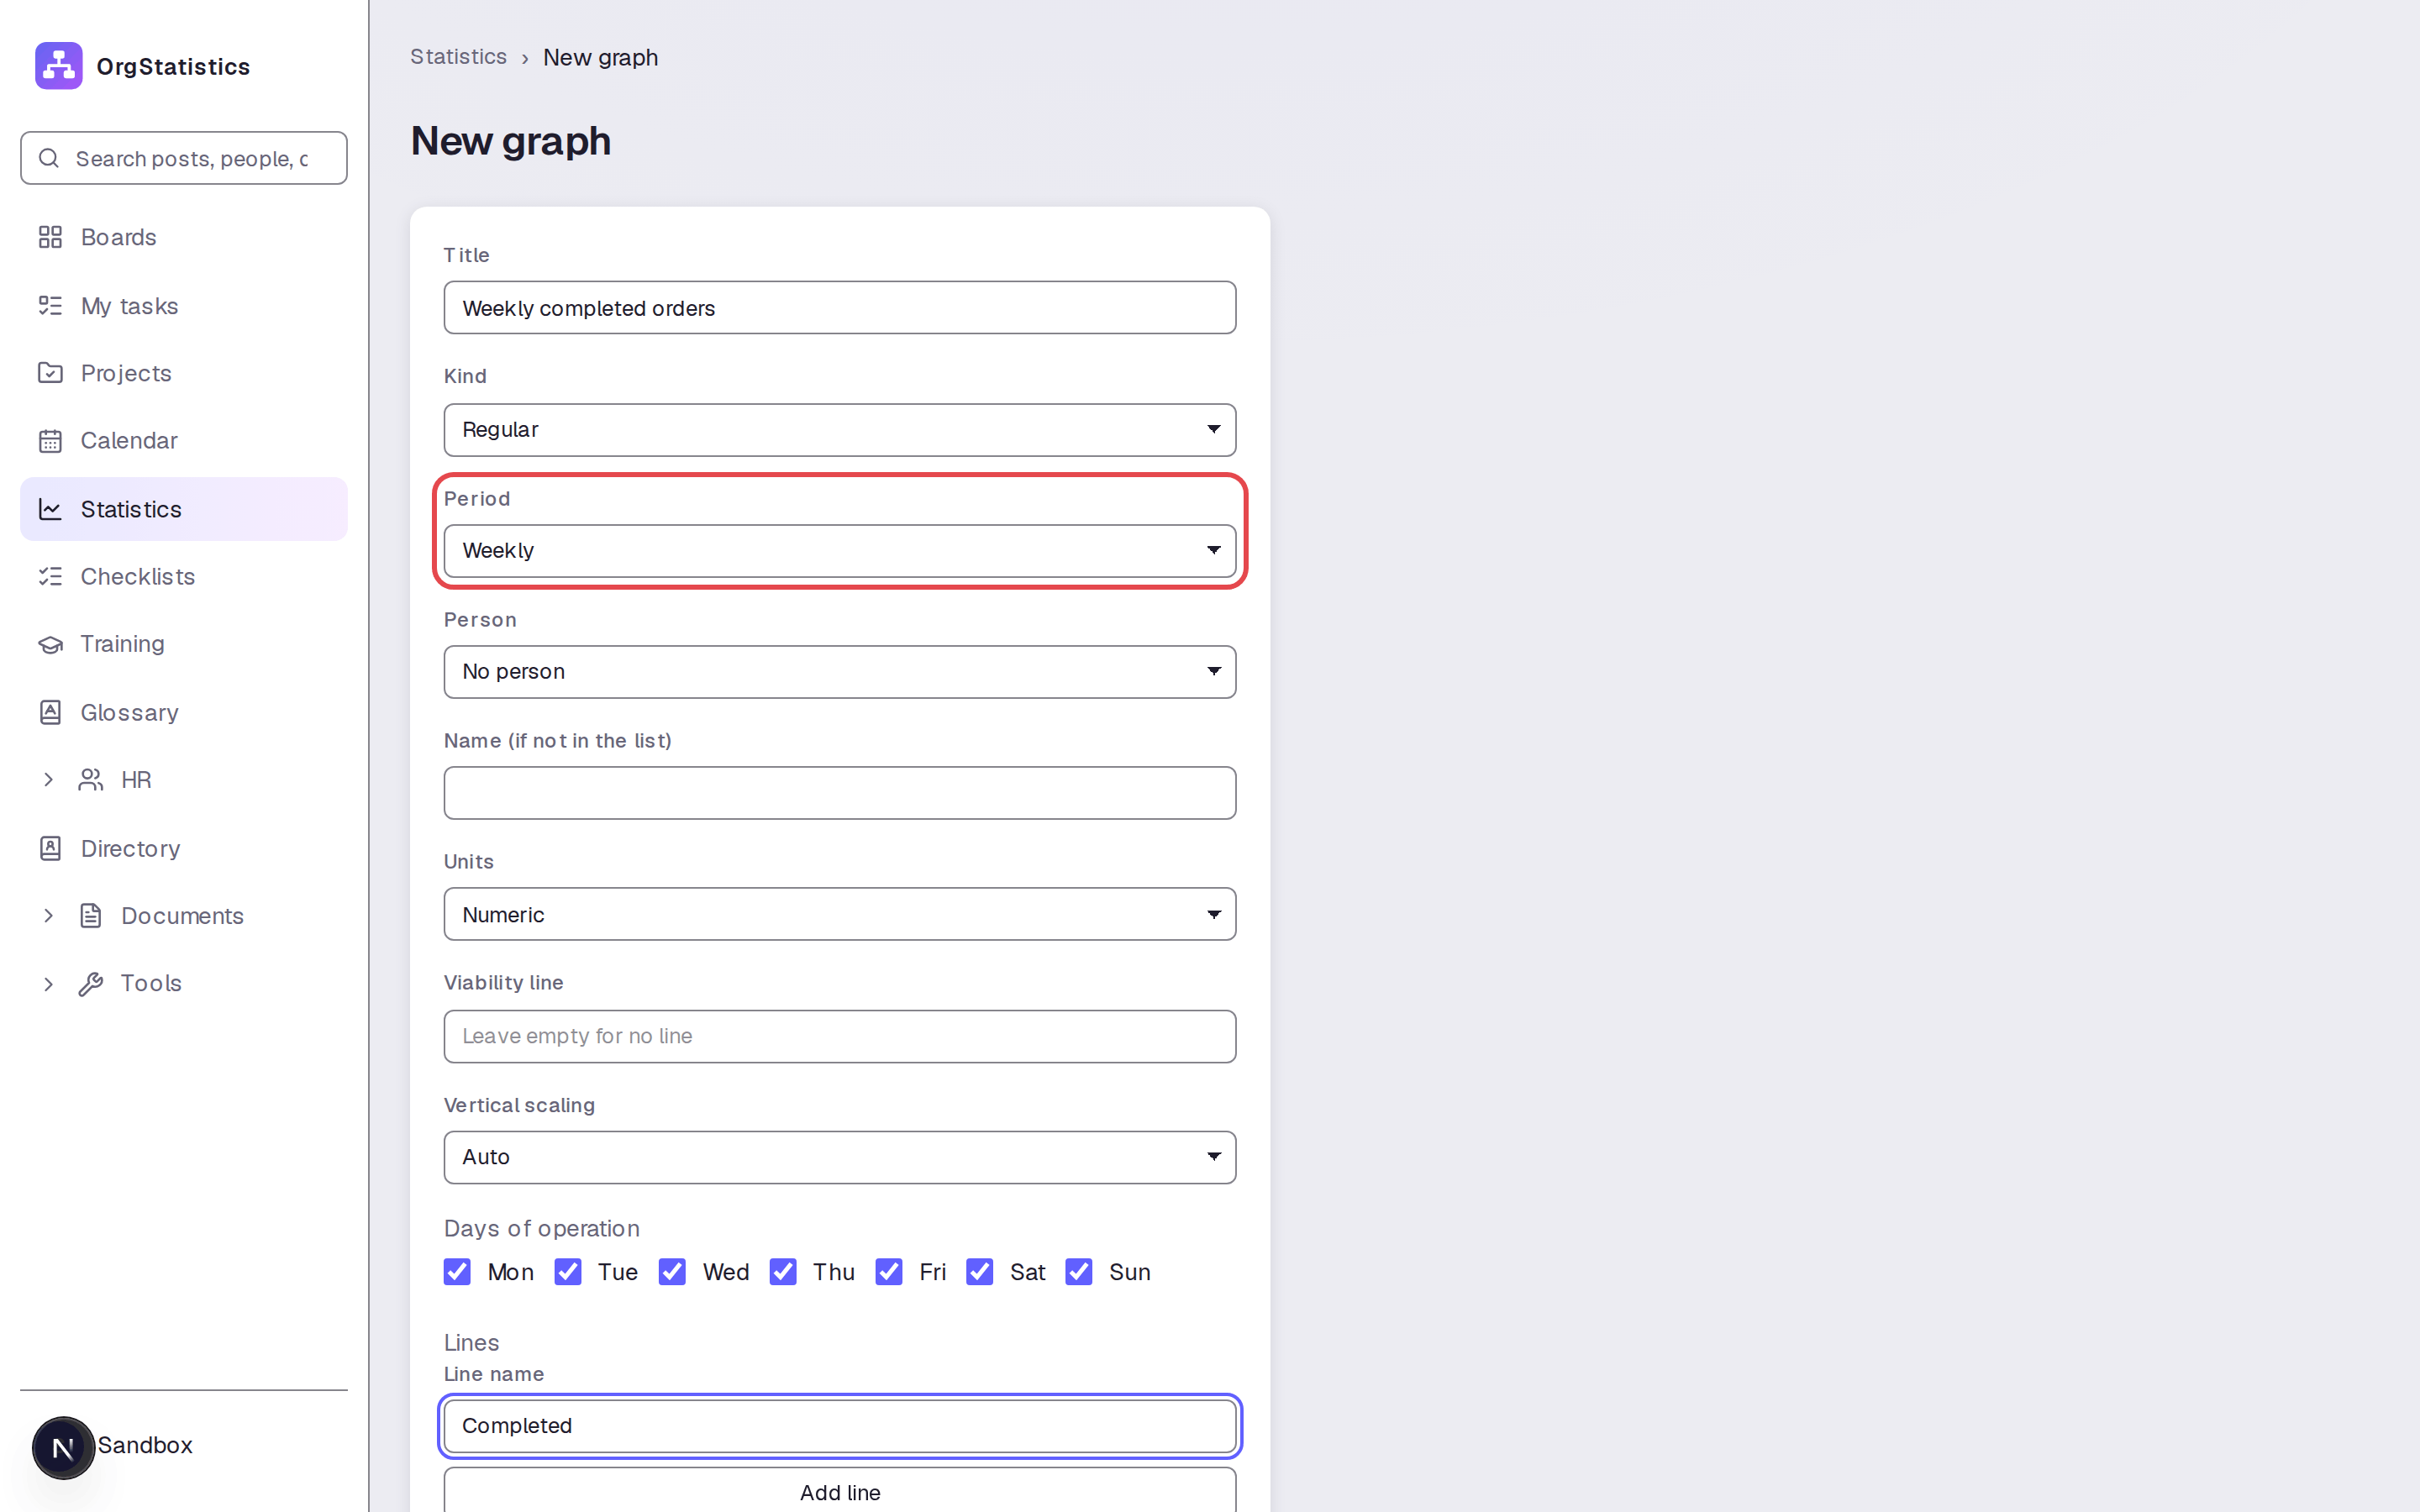
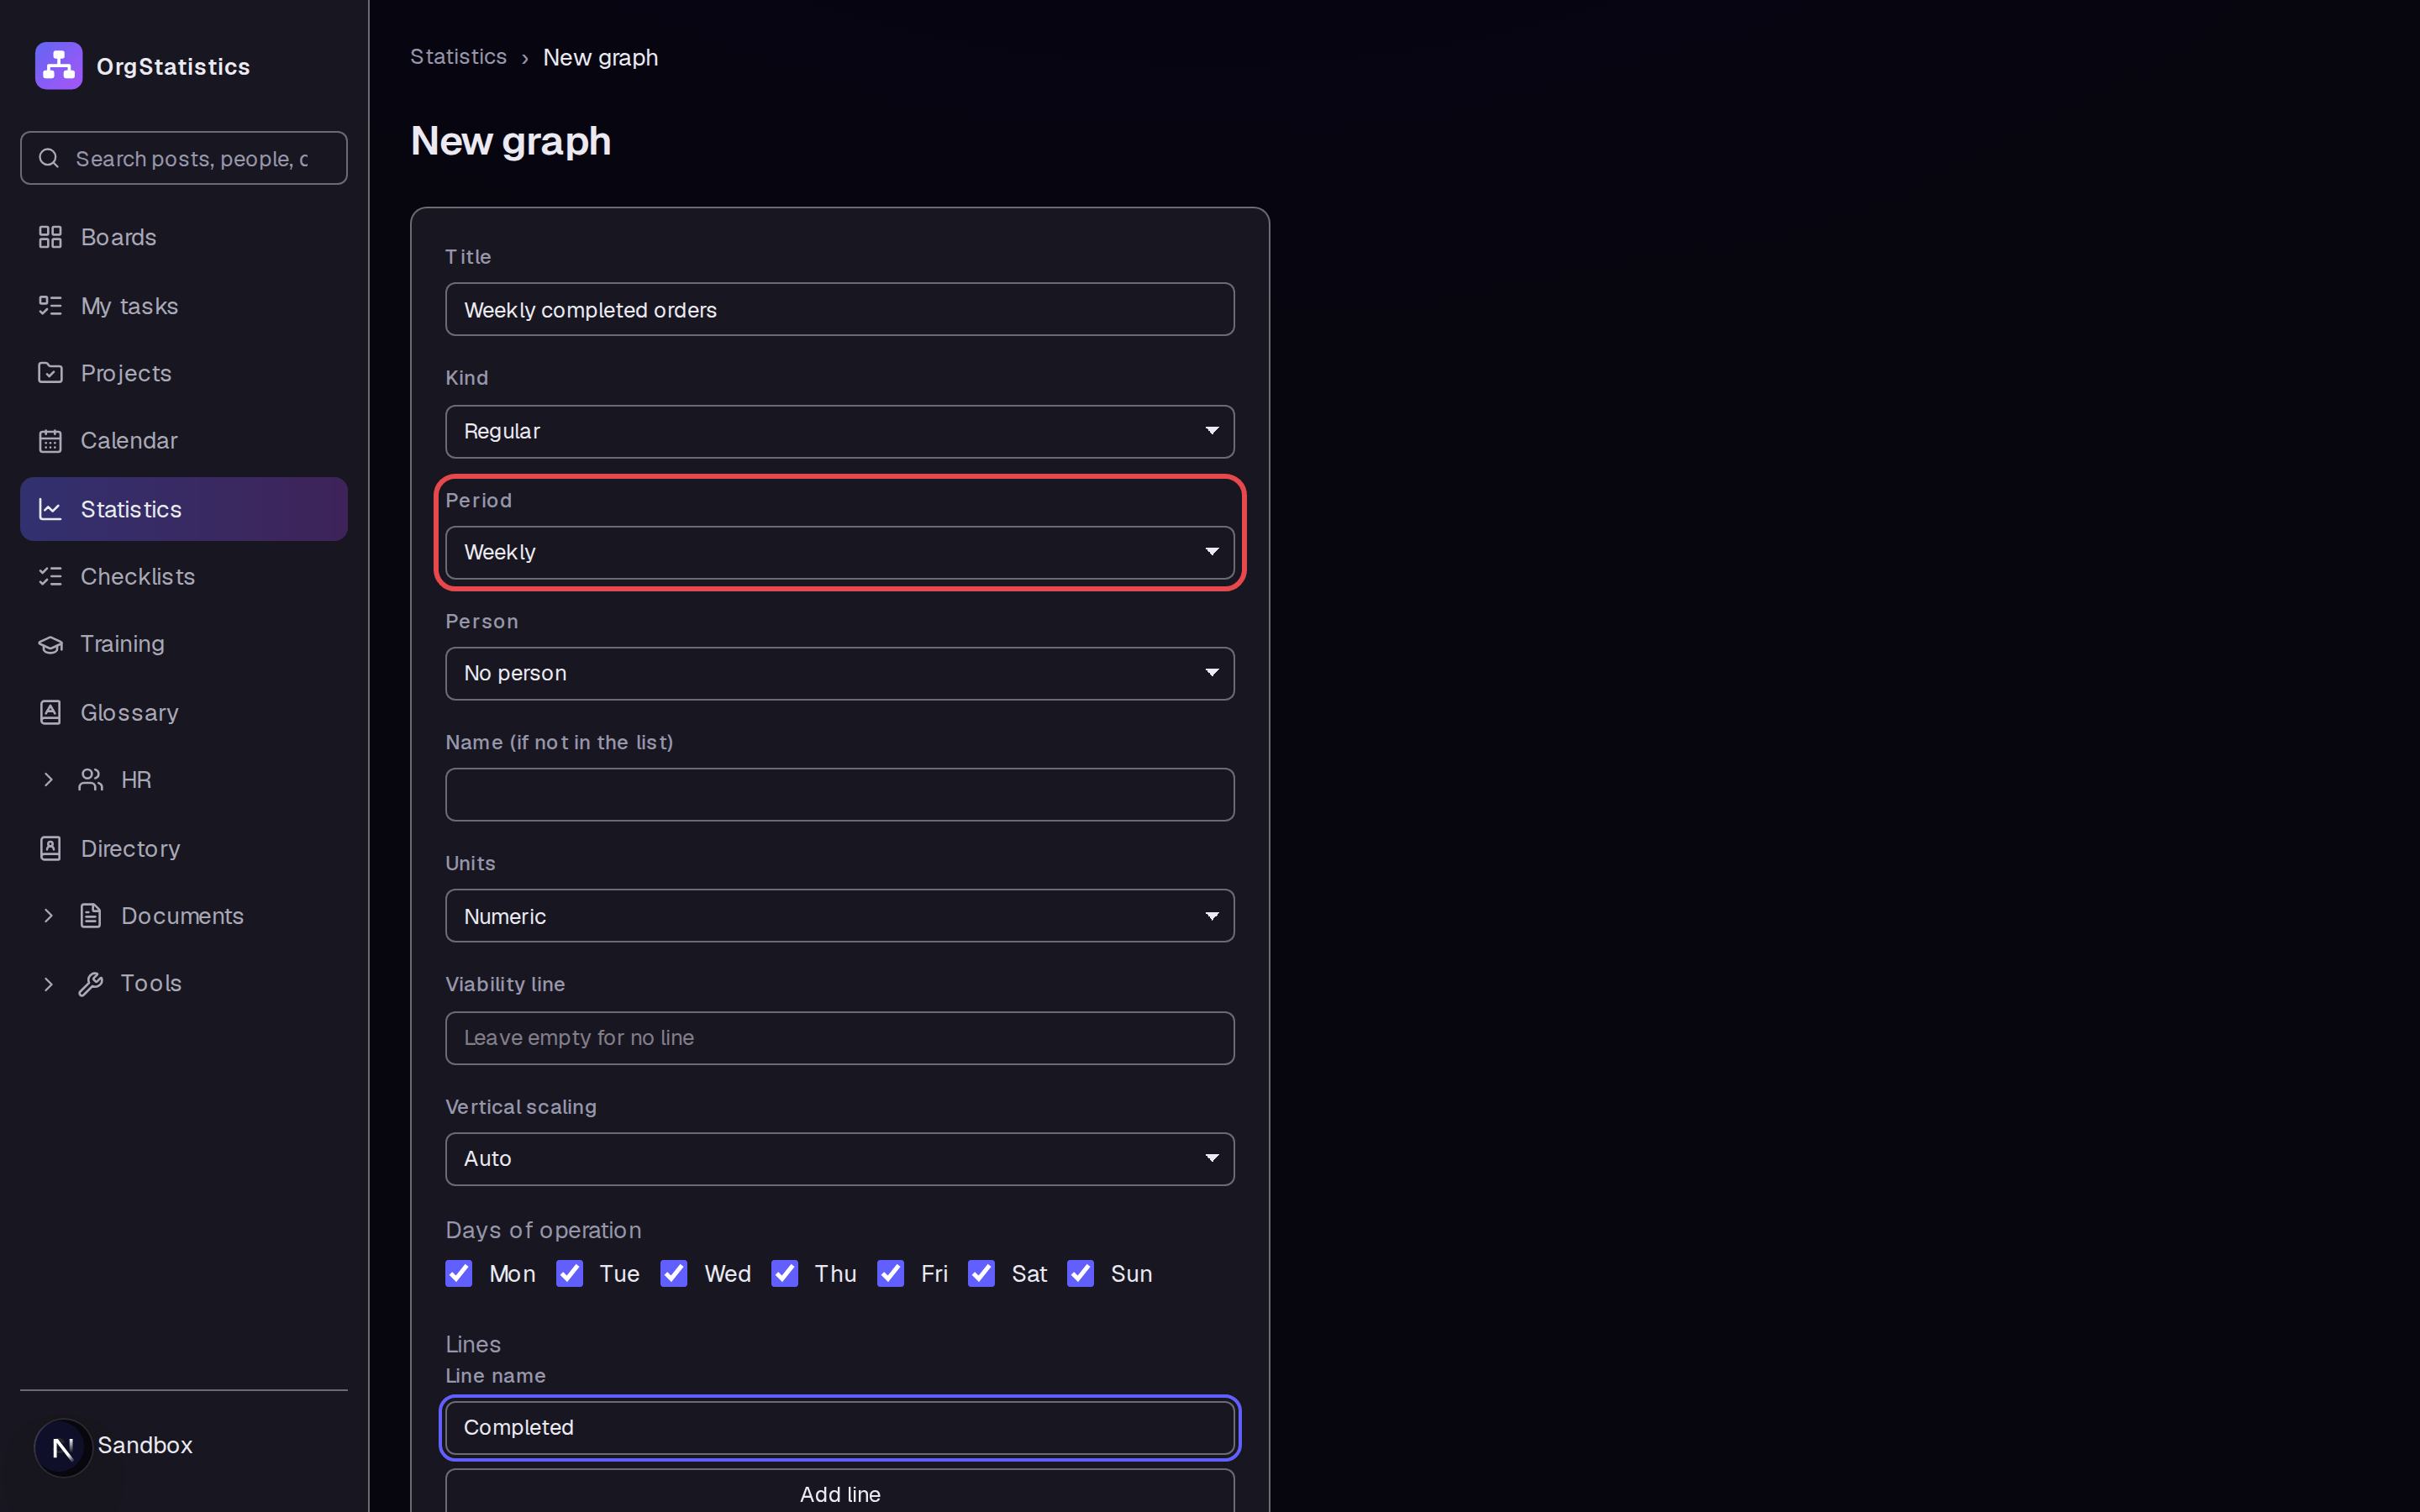
Select Create graph and enter “Weekly completed orders” in Title. Keep Kind set to Regular, then set Period to Weekly. Enter “Completed” in Line name.
Step 3 — Save the graph
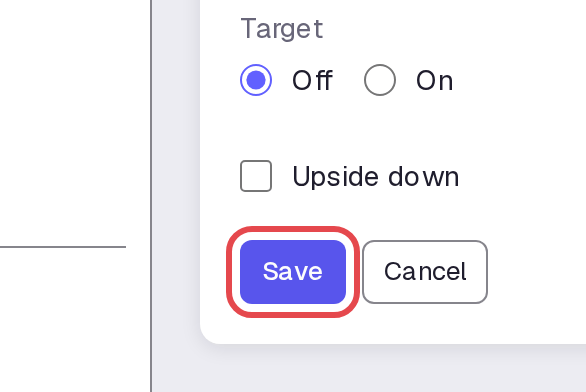
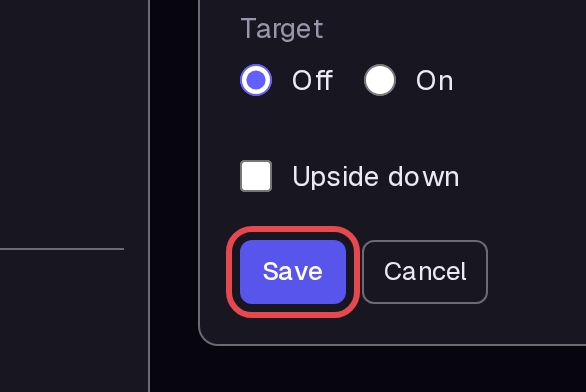
Select Save. The graph opens with no values.
Step 4 — Open value entry
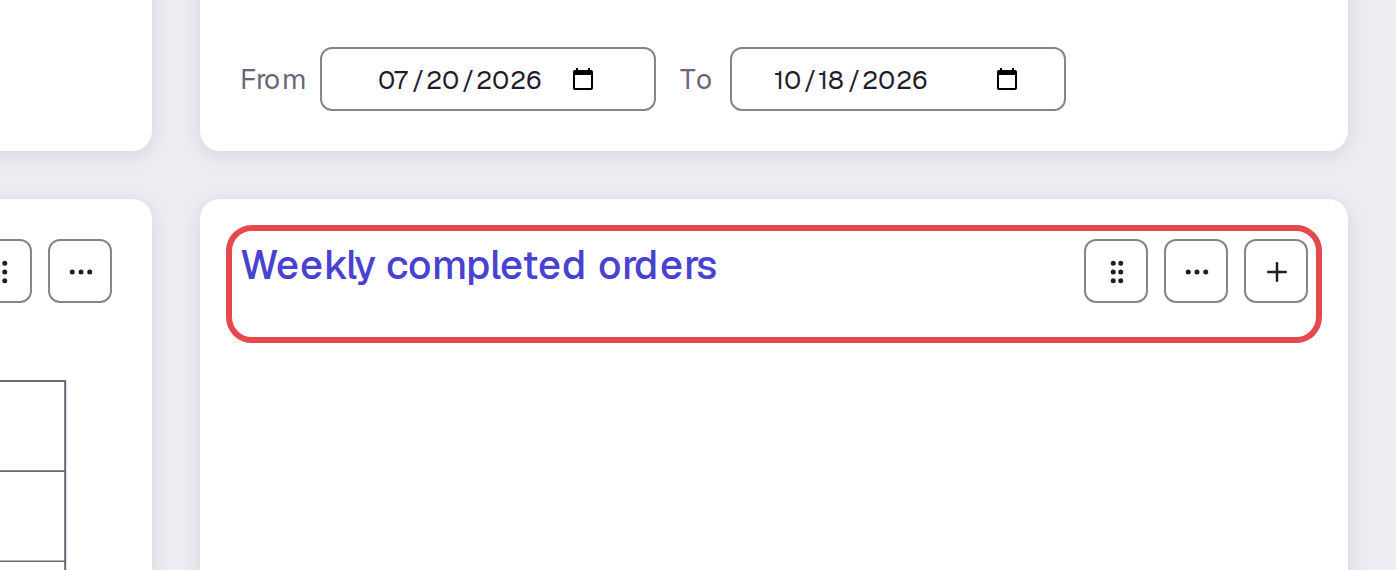
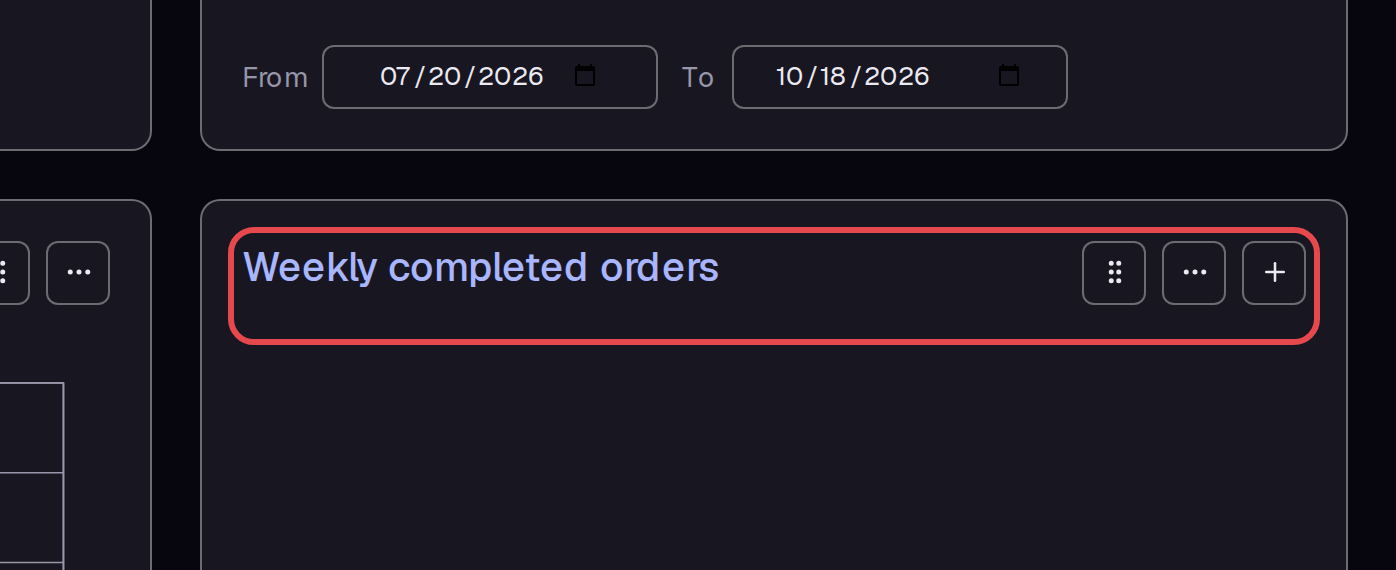
Return to Statistics. Find Weekly completed orders and select its plus button, Add value.
Step 5 — Enter weekly values
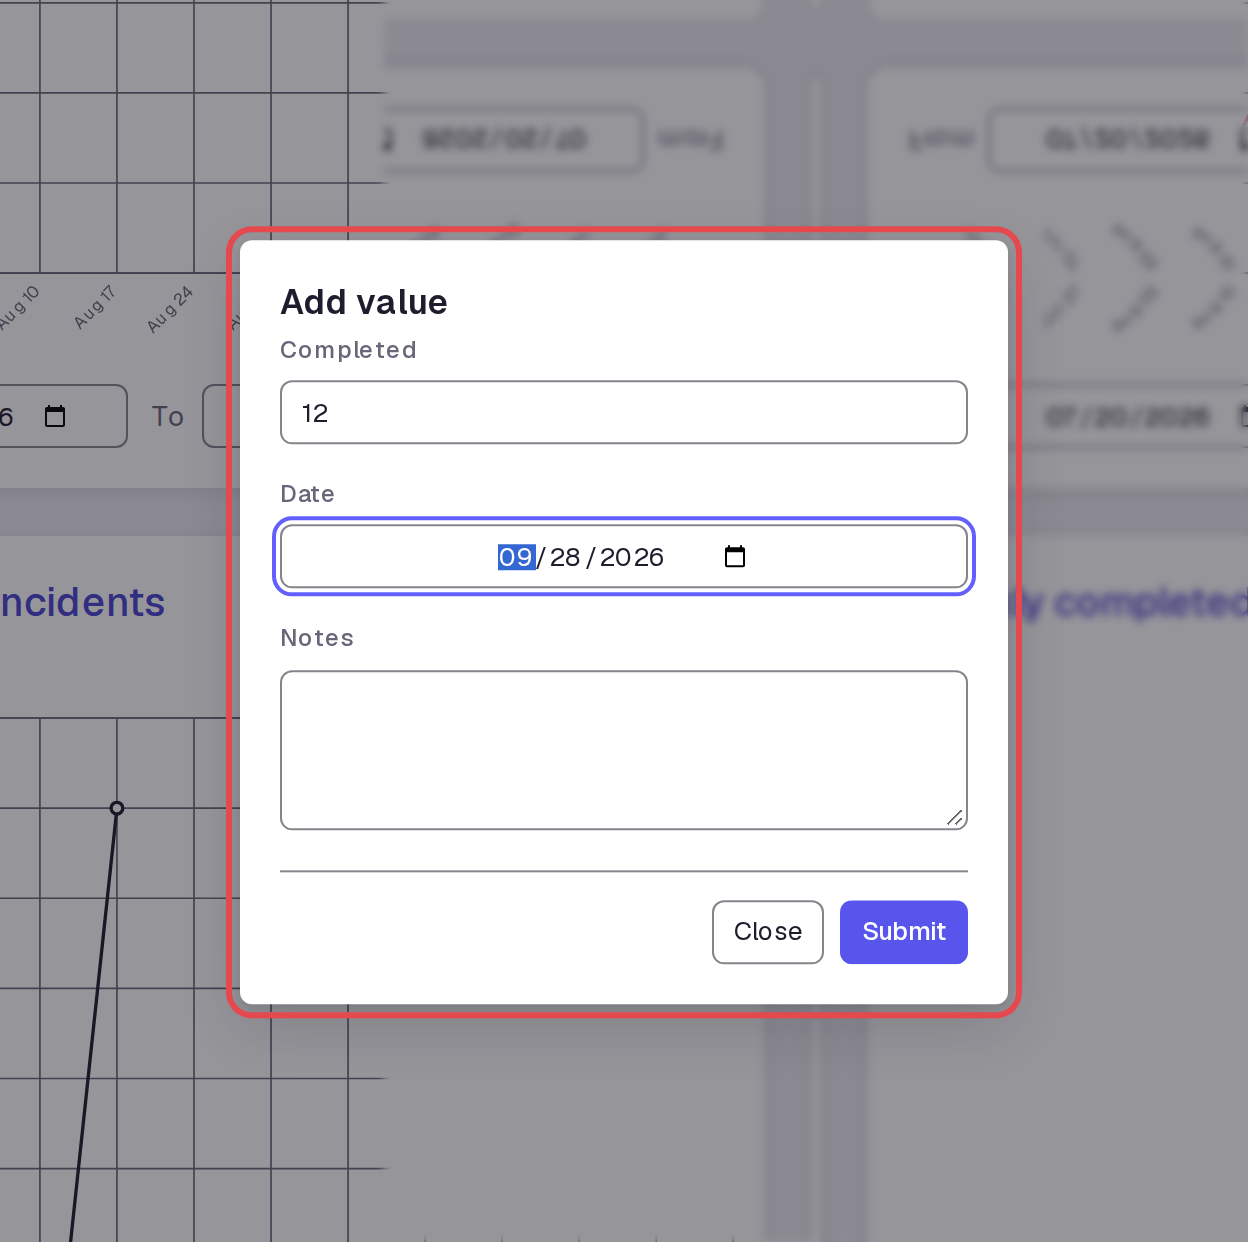
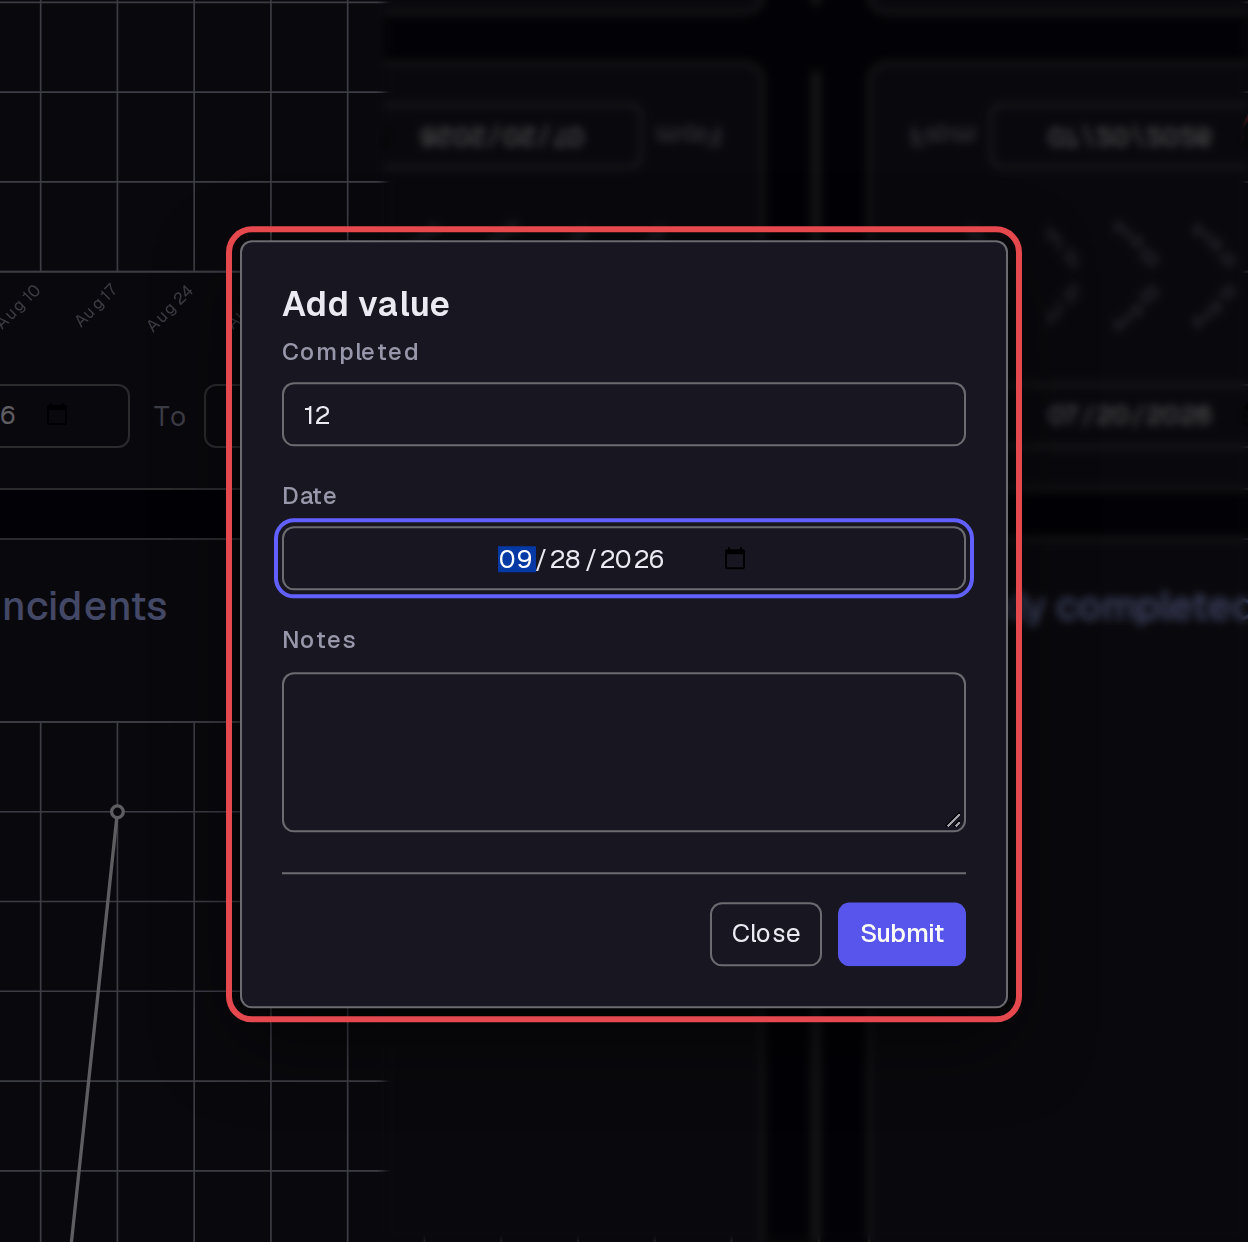
Enter 12 in Completed and September 28, 2026 in Date, then select Submit. Repeat with 18 for October 5, 2026. Repeat with 15 for October 12, 2026.
Step 6 — Set the date range
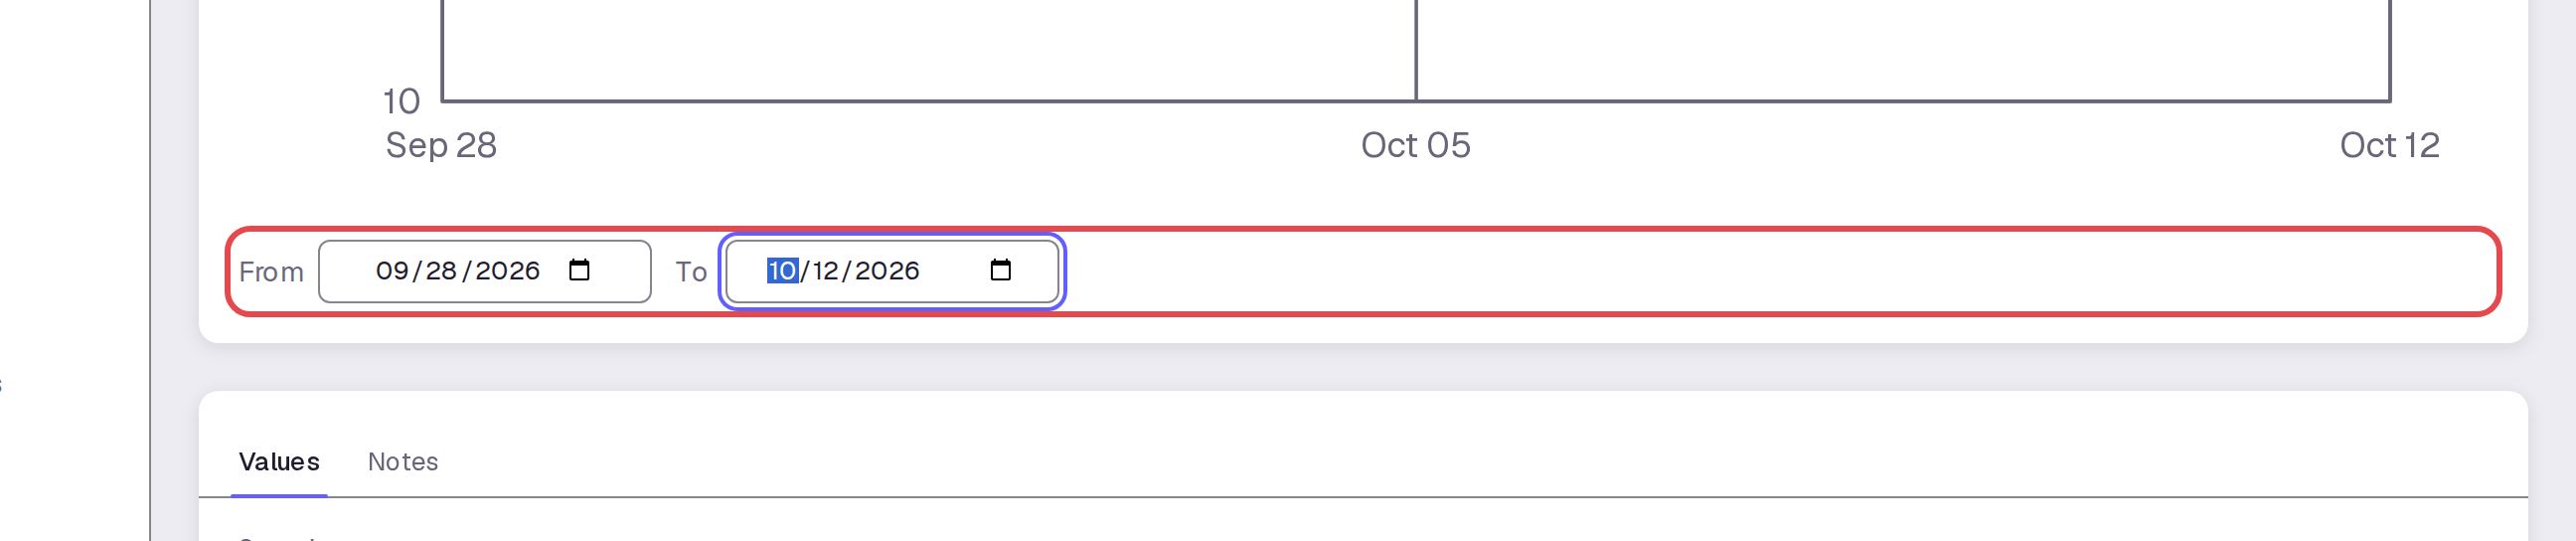
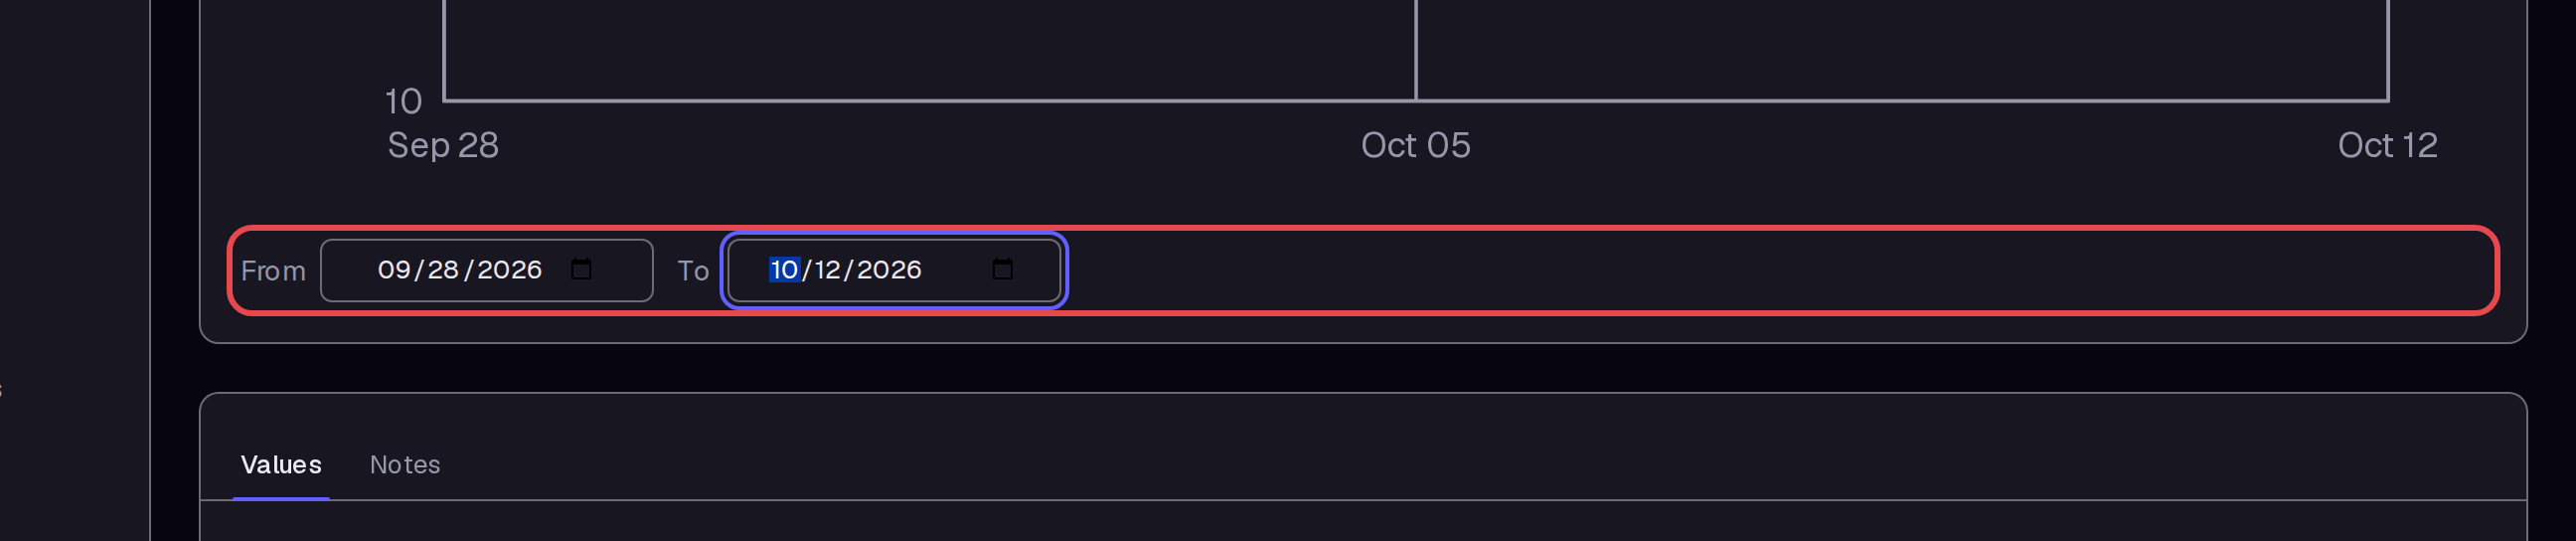
Select the graph title to open it. Set From to September 28, 2026 and To to October 12, 2026 below the graph.
Step 7 — Read the change
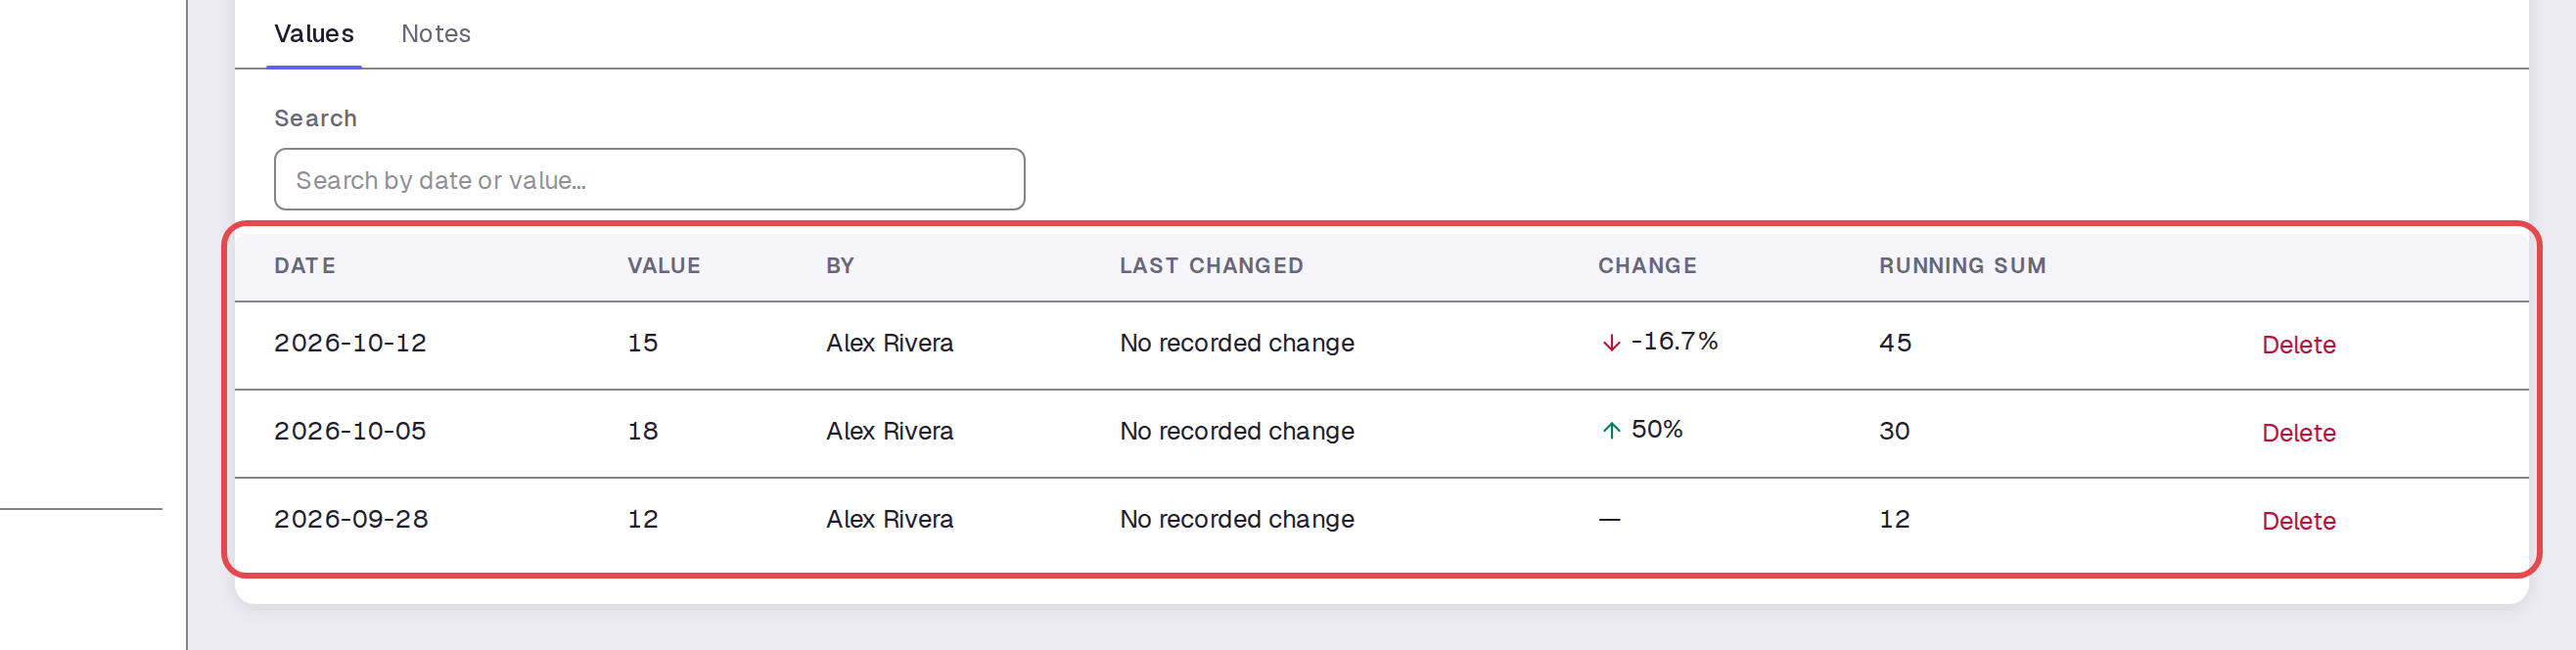
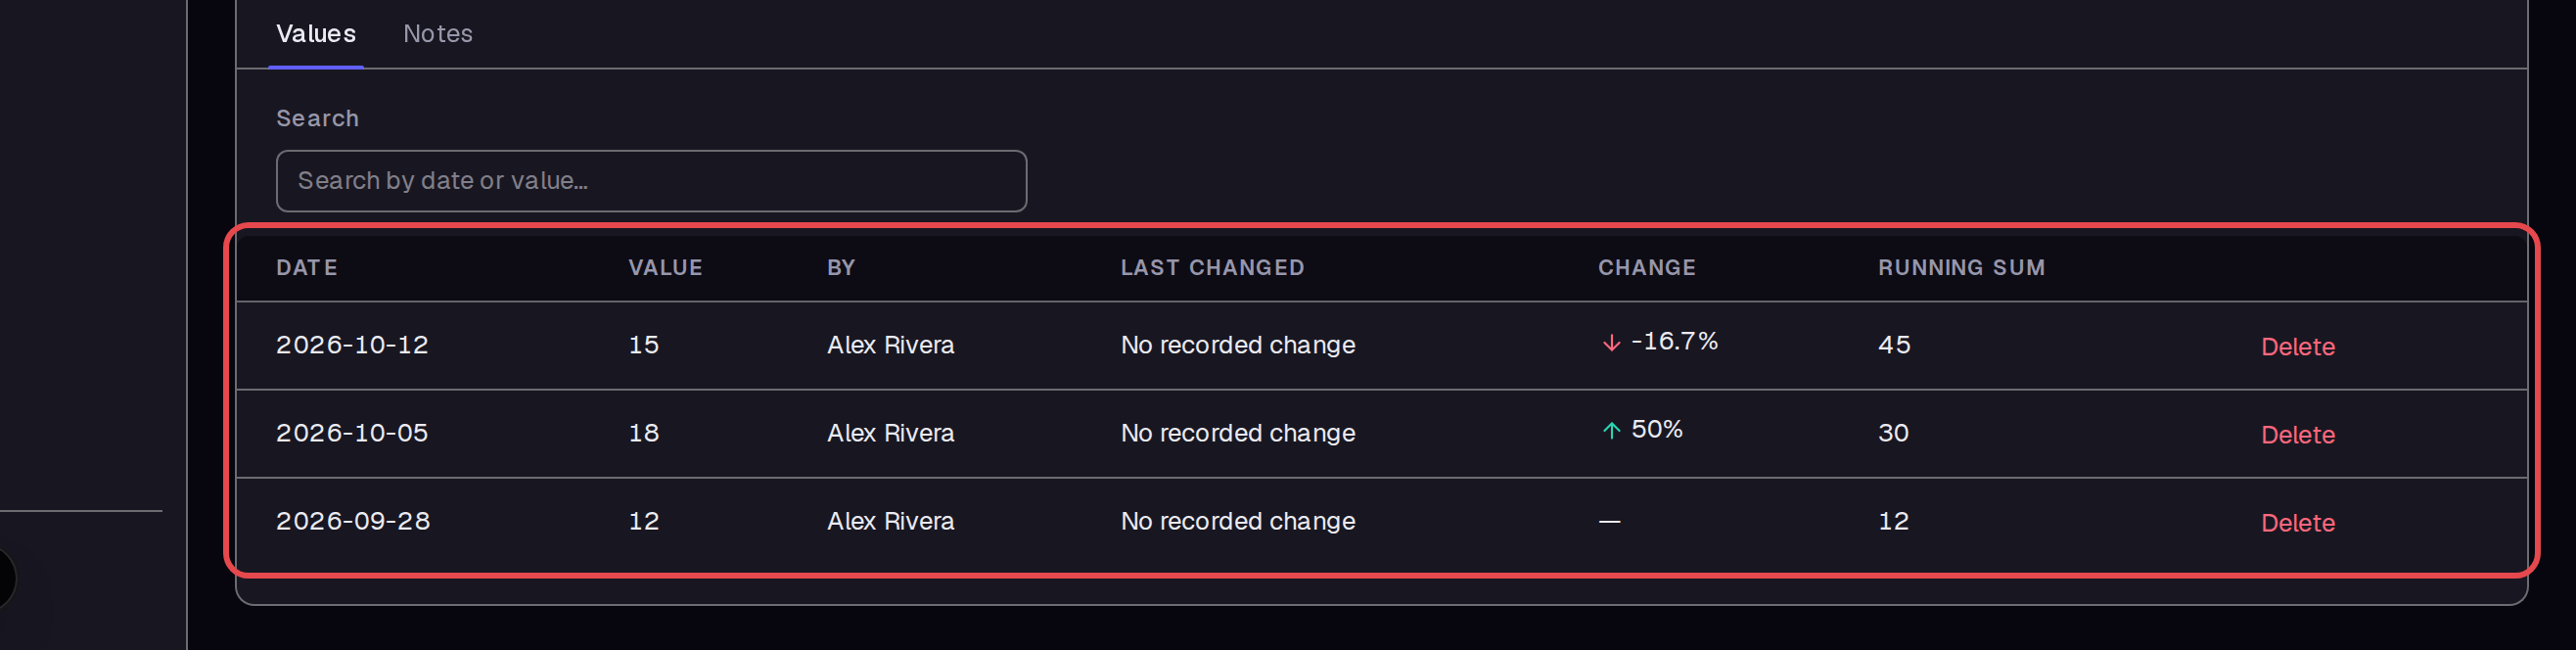
Read the Values table below the graph. The value rose from 12 to 18, then fell to 15. CHANGE shows 50% for the increase and -16.7% for the decrease; the newest row appears first.
Step 8 — Open the post editor
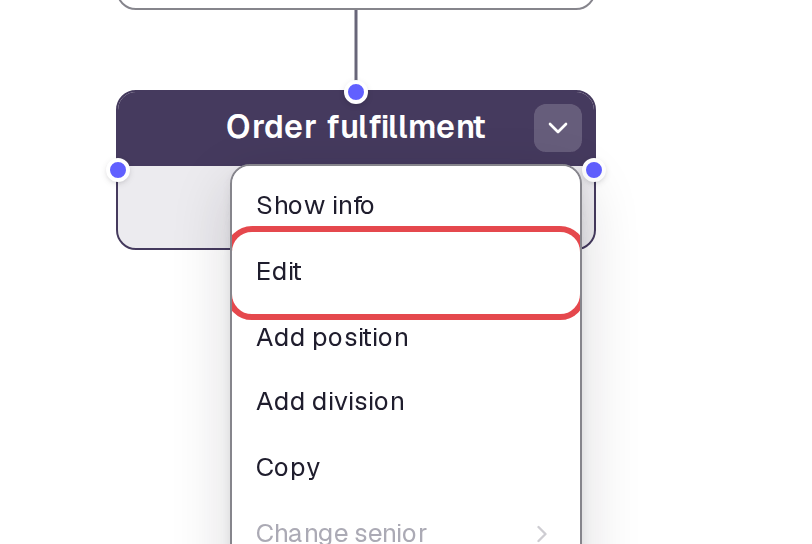
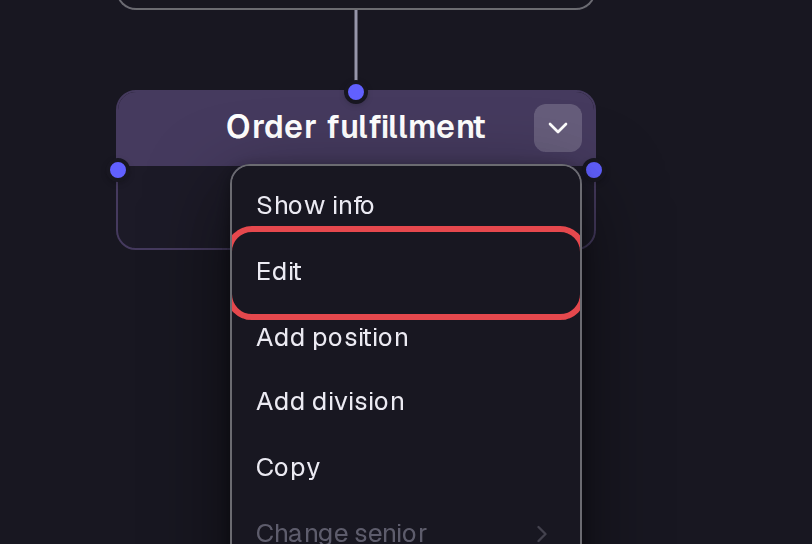
Select Boards and find your post. Open the small arrow on its box, then select Edit.
Step 9 — Add a post statistic
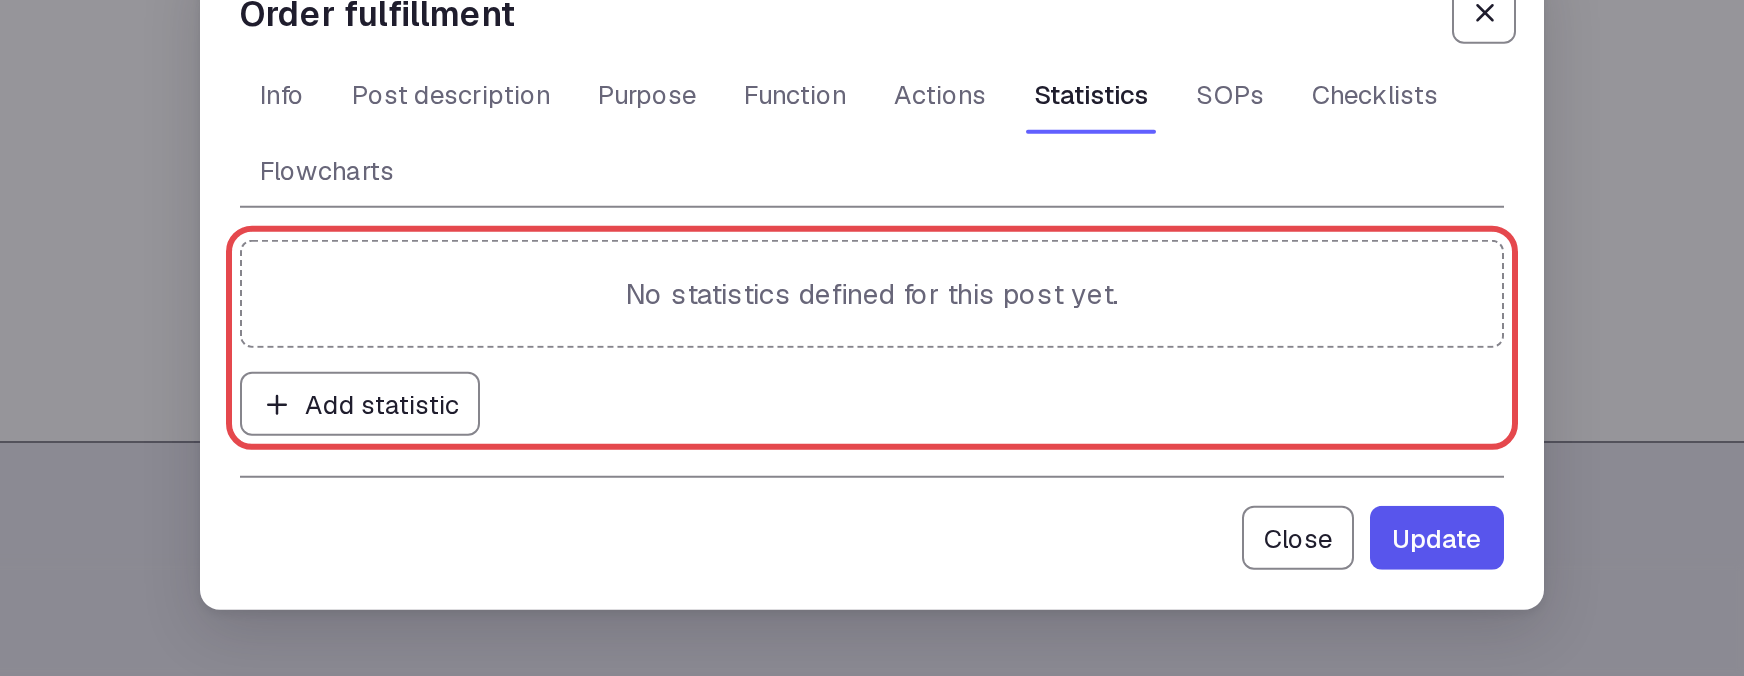
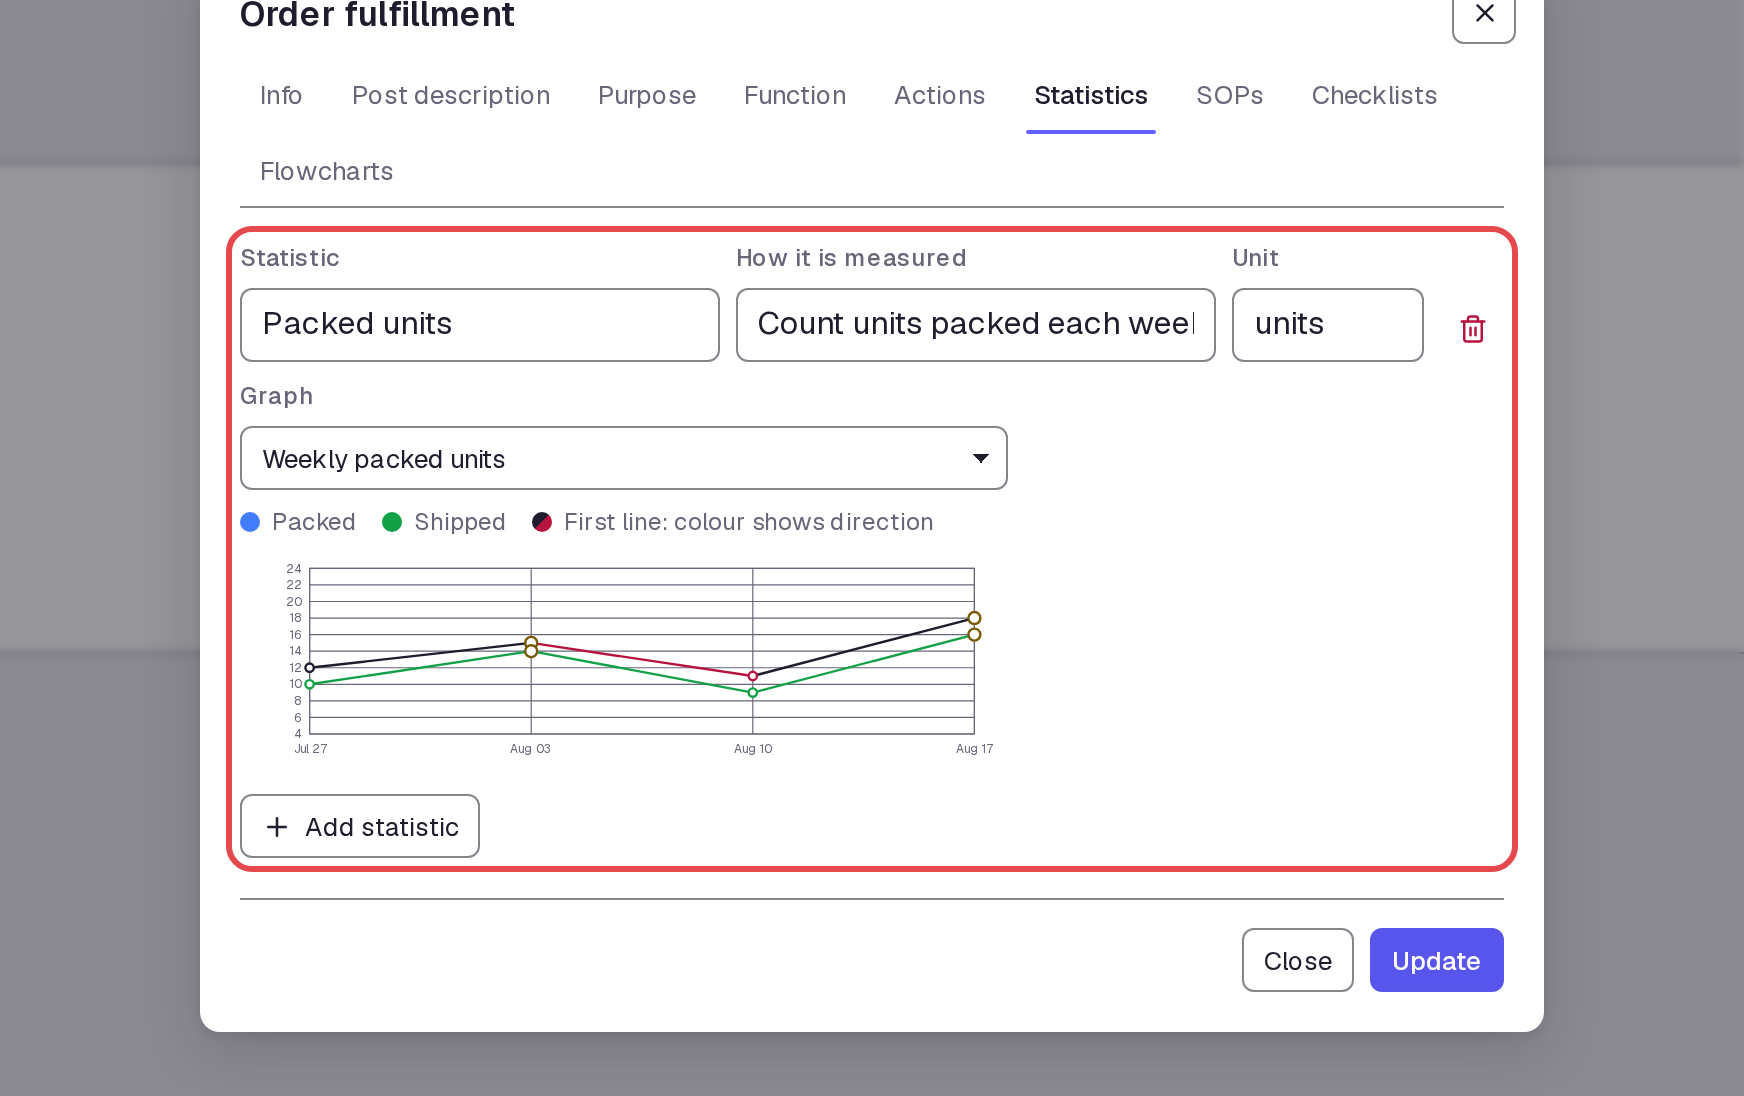
Open the Statistics tab. Select Add statistic.
Step 10 — Choose an available graph
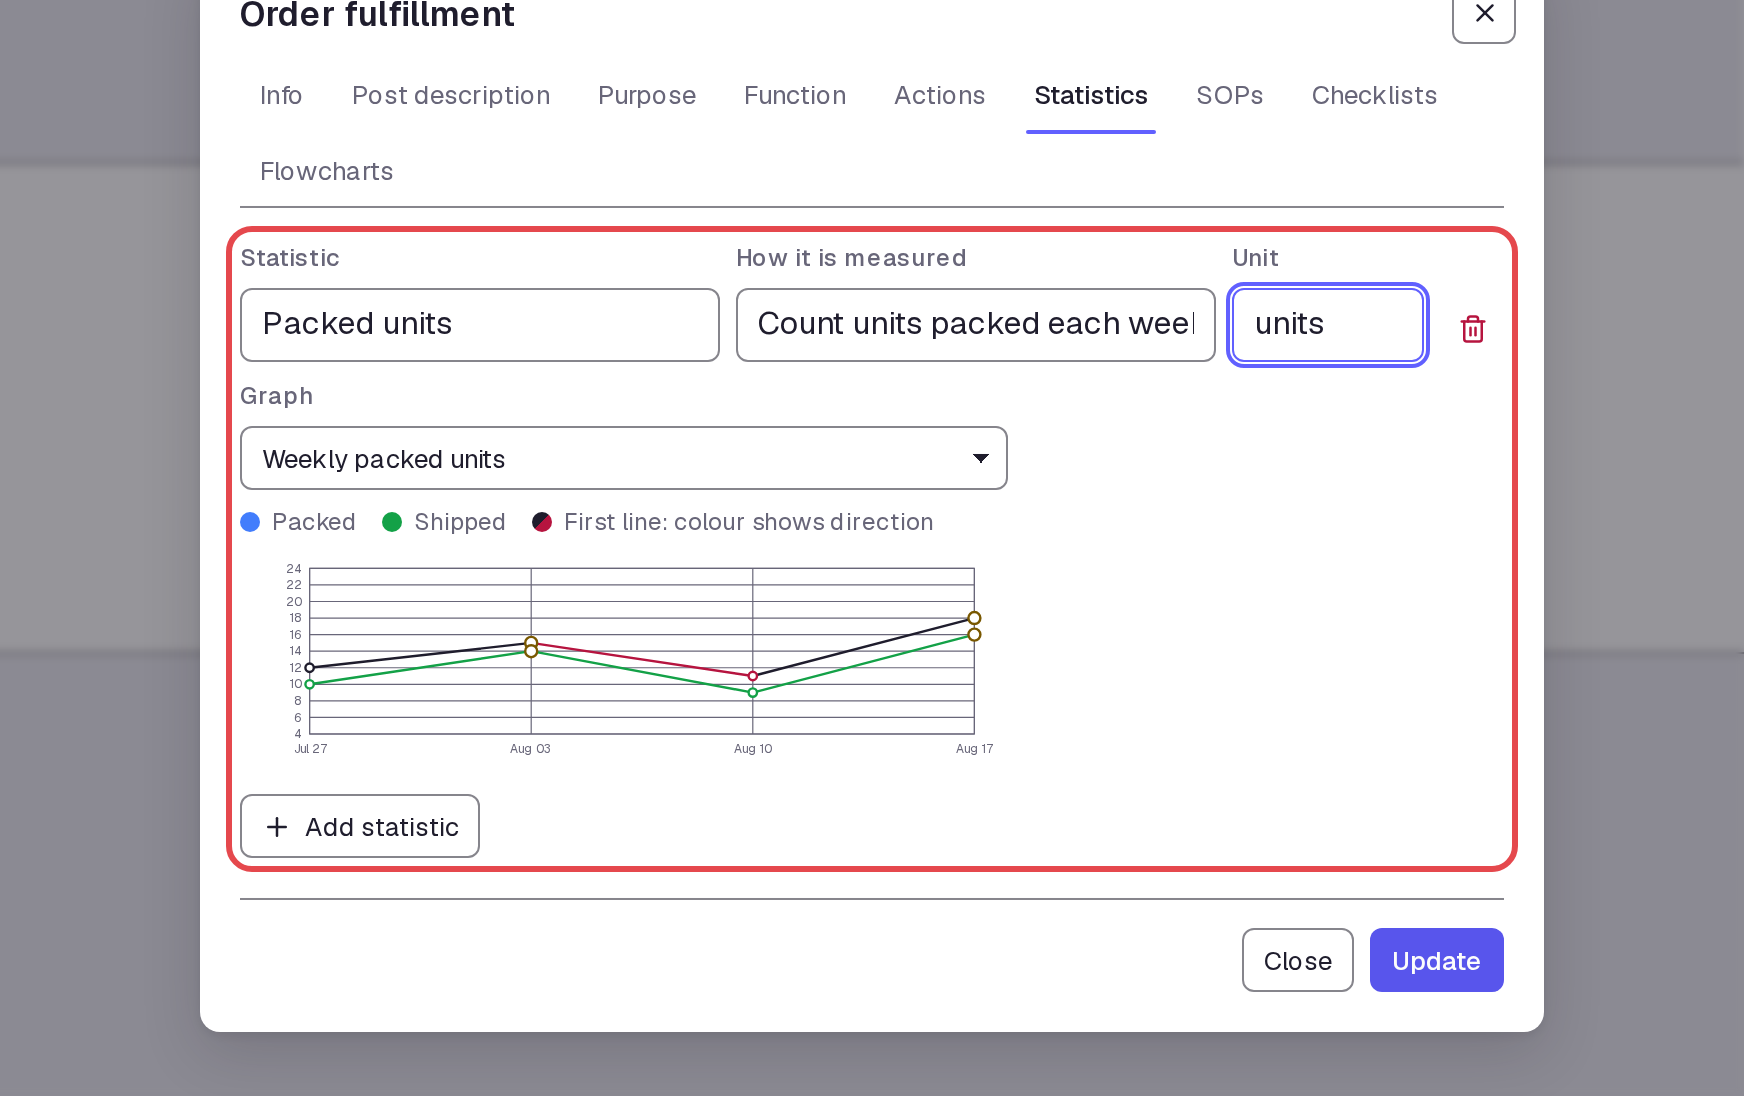
Enter “Packed units” in Statistic and “Count units packed each week” in How it is measured. Enter “units” in Unit. In Graph, select the available graph Weekly packed units.
Step 11 — Save the post
Select Update to save the statistic and graph link.
Step 12 — Check the saved graph link
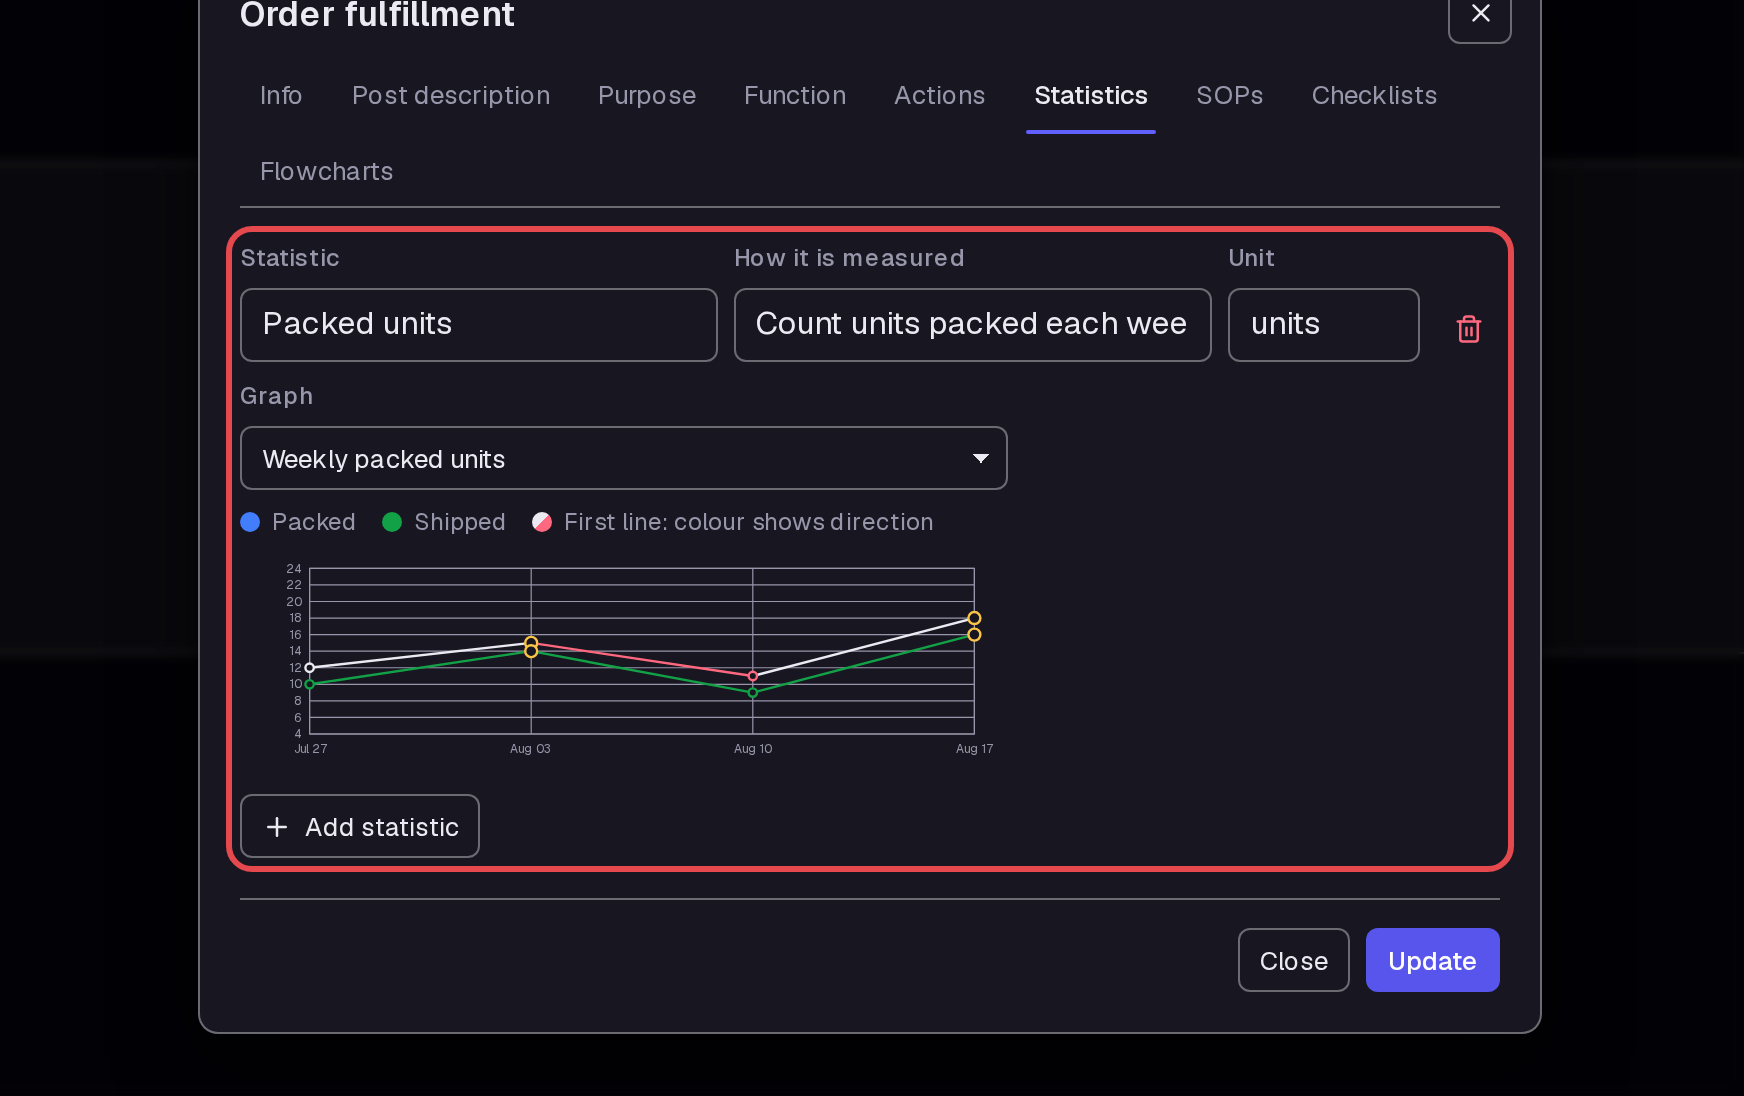
Open the post's Edit menu again, then open Statistics. Check the selected graph and its preview.
Tips
- Use Period to set the recording interval; use From and To to set the visible date range.
- Read CHANGE with VALUE. The example's
-16.7%describes the fall from18to15. - Read the newest value in the first row of the table.
- Choose a graph listed in the post's Graph menu.
What next
Write SOPs, documents, and policies for the work that produces these results.