How to edit a graph and compare statistics
about 8 minutes
An existing graph can need a clearer name, a target, or a corrected value. A manager can make these changes, then use the Statistics page to compare results.
Before you start
For a weekly view, click Weekly summary on Statistics.
Step 1 — Open the existing graph
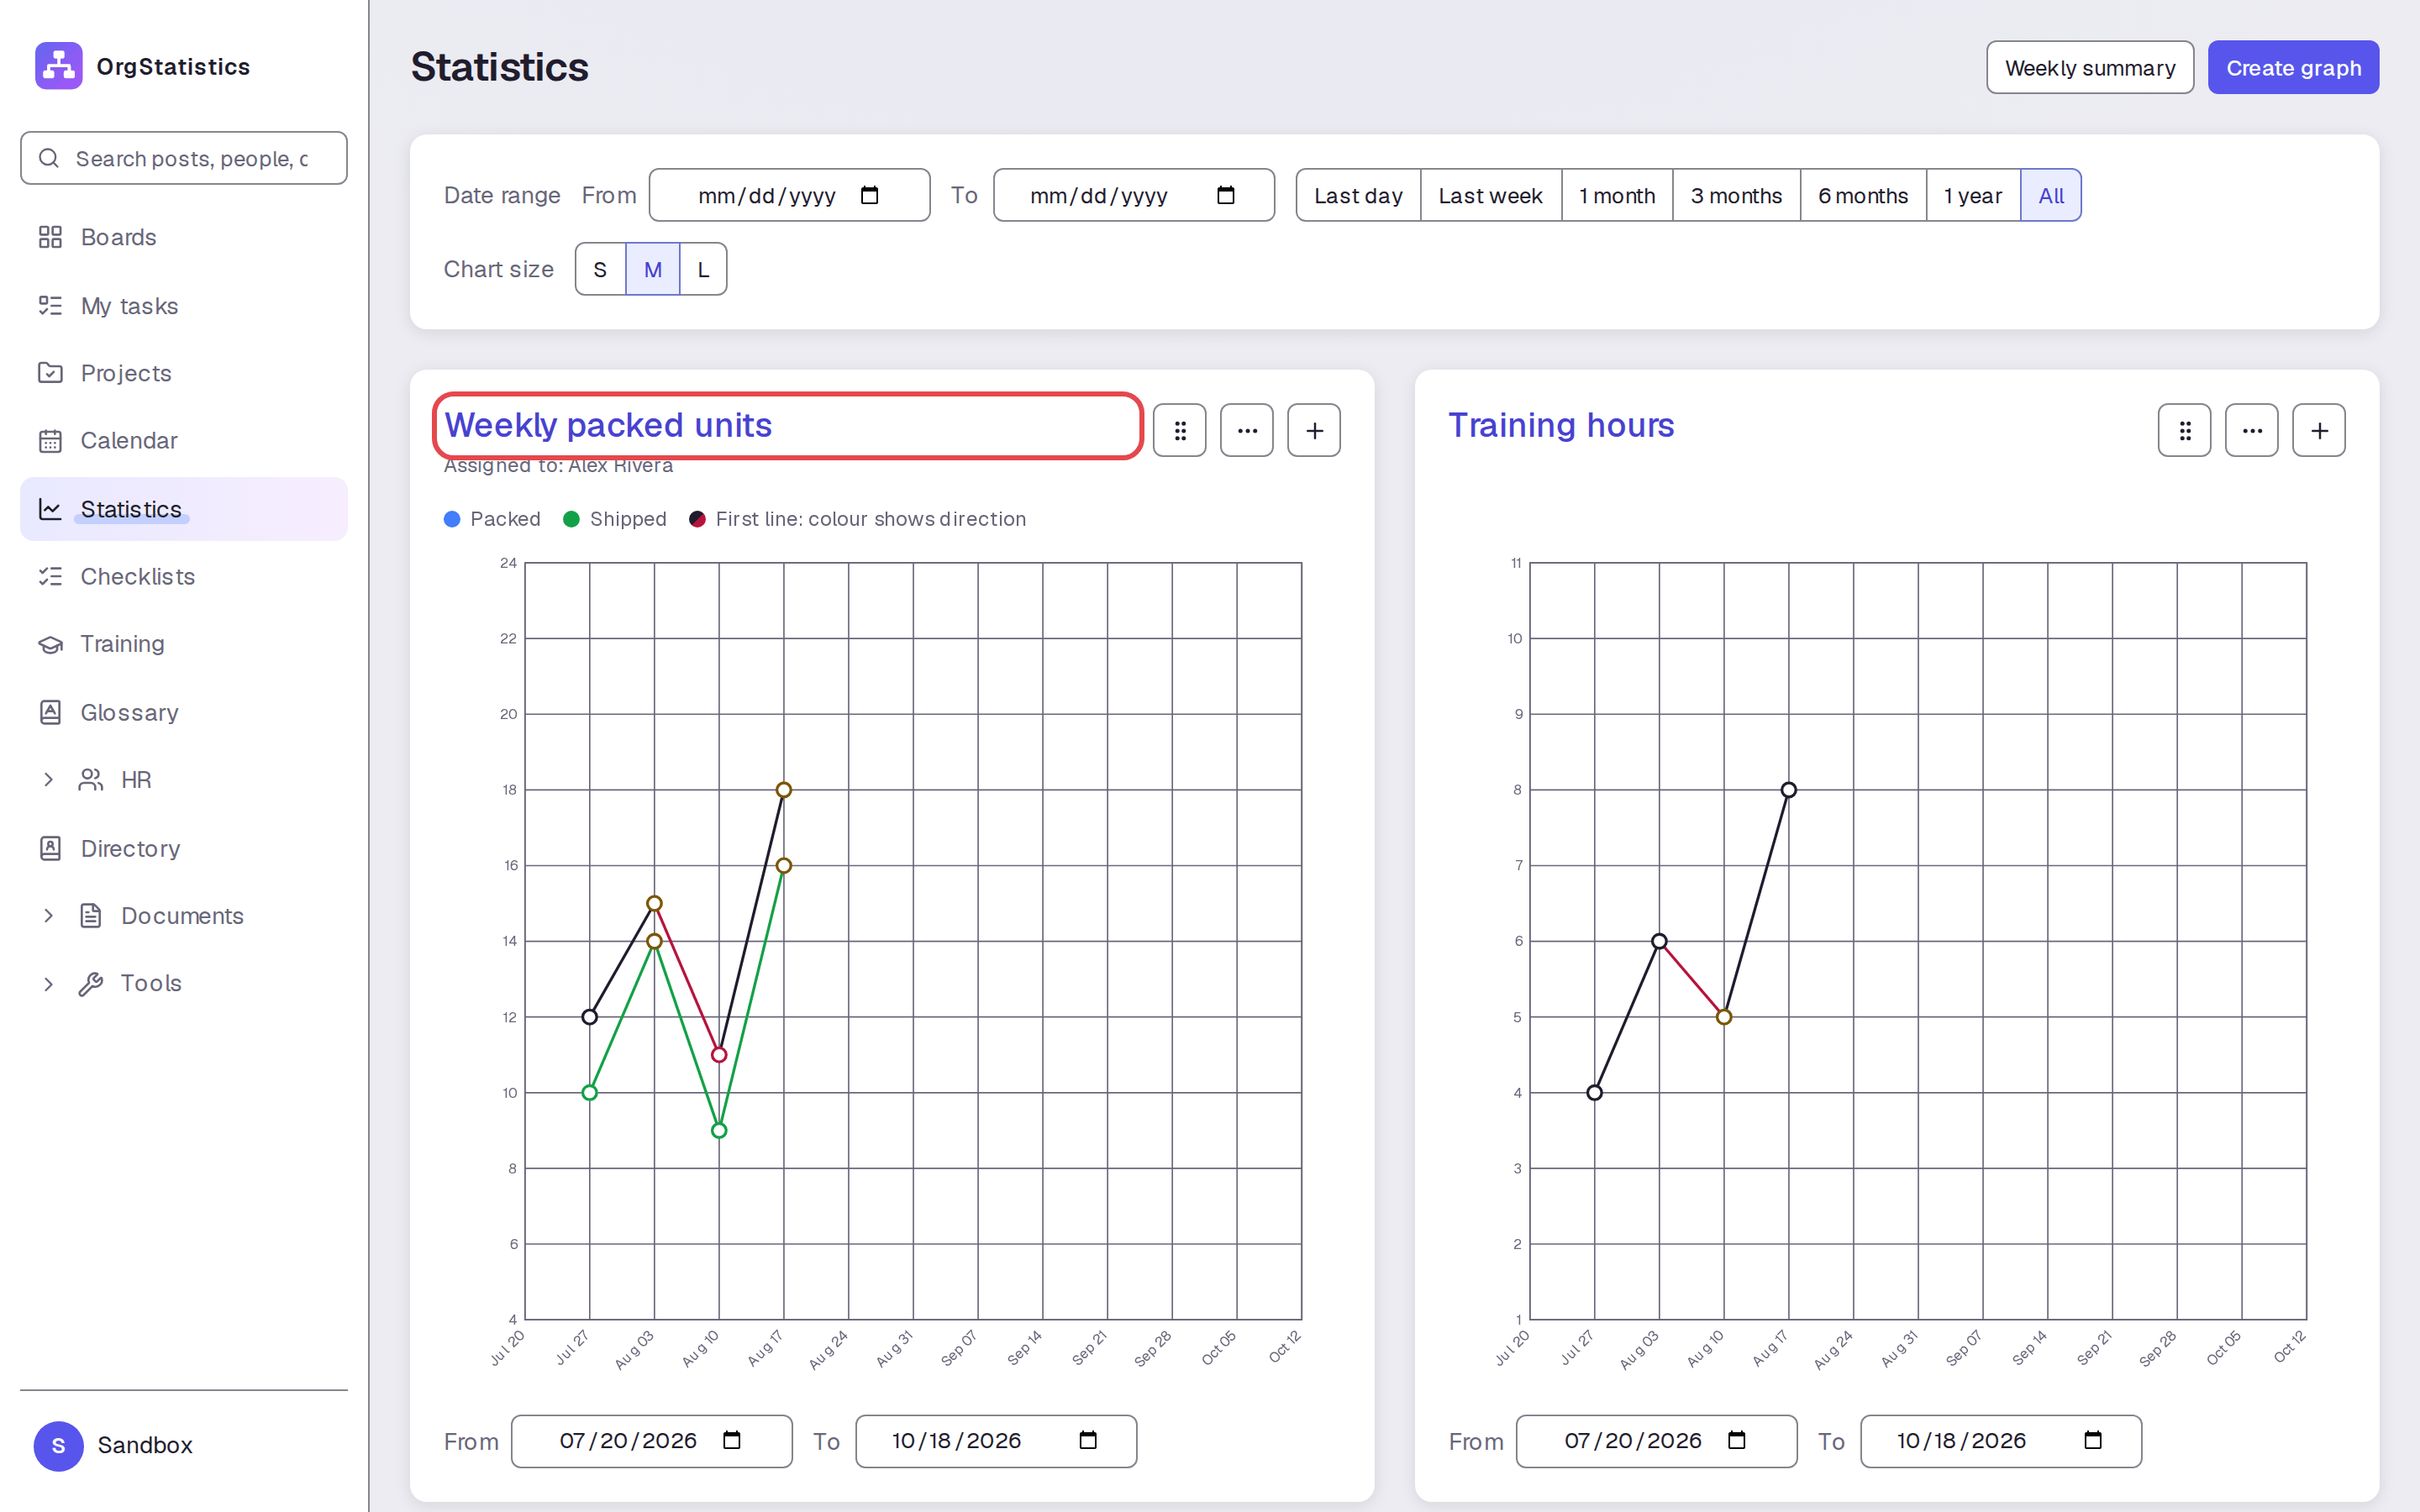
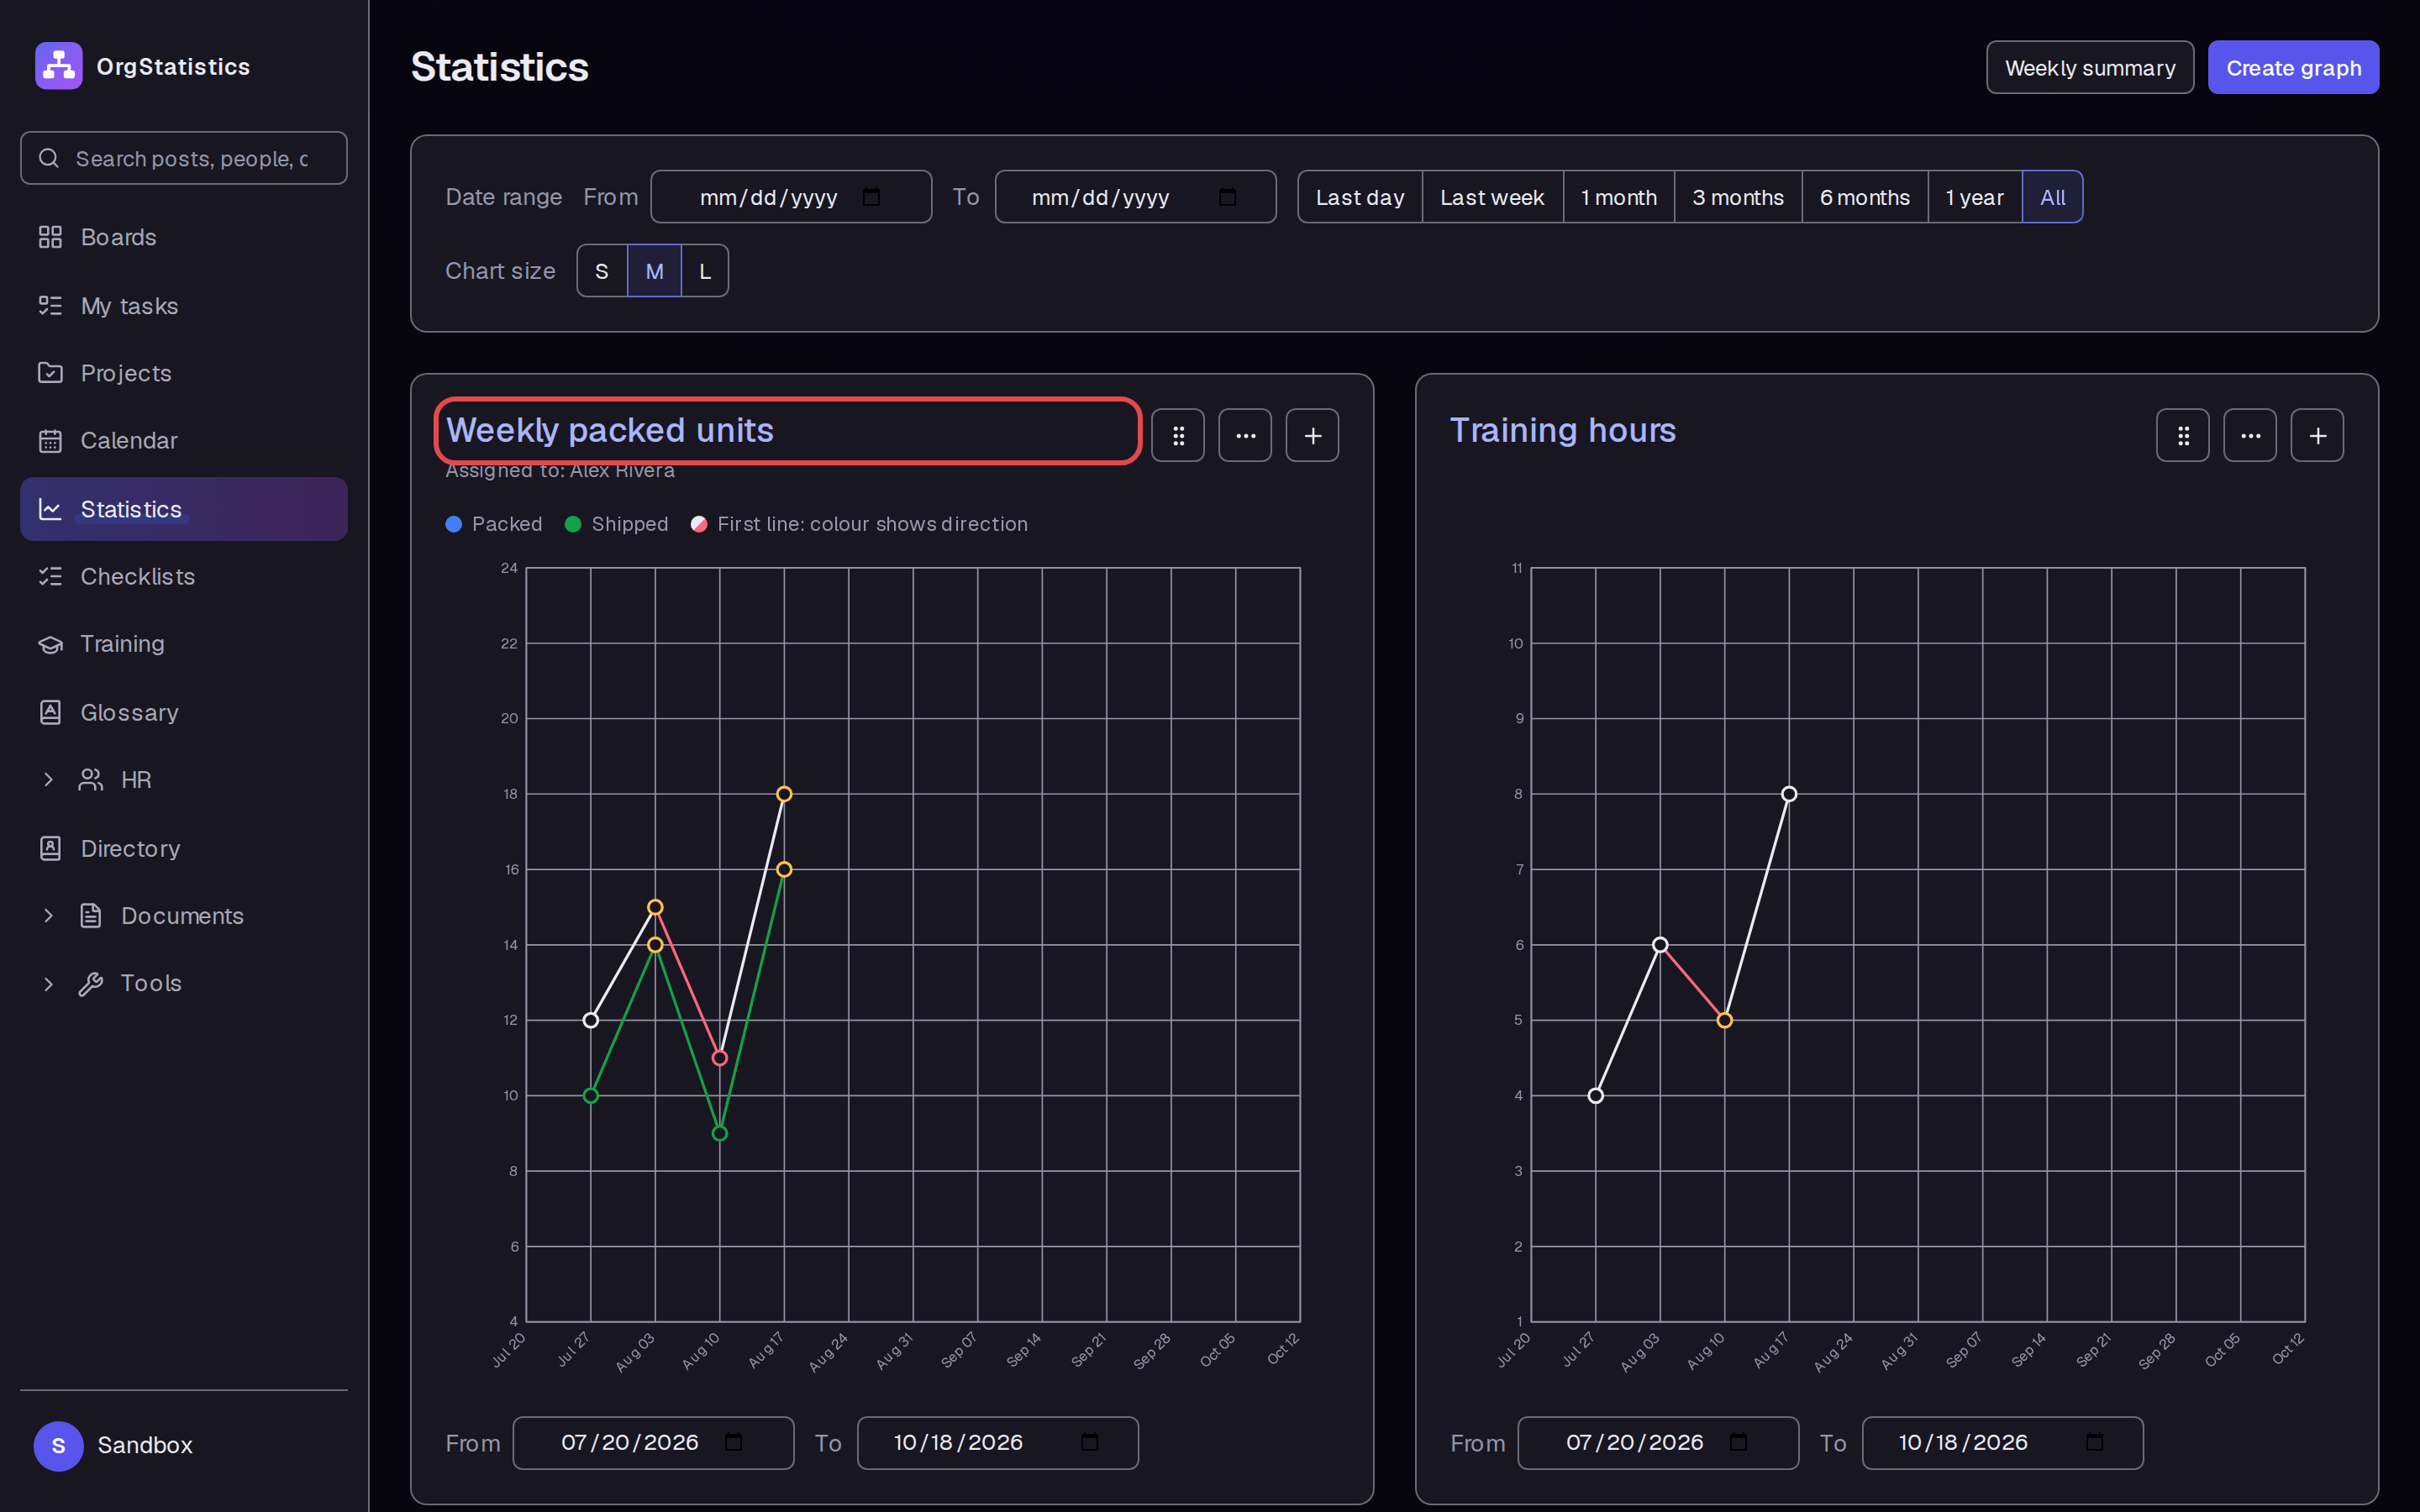
Open Statistics. Click Weekly packed units.
Step 2 — Change the title
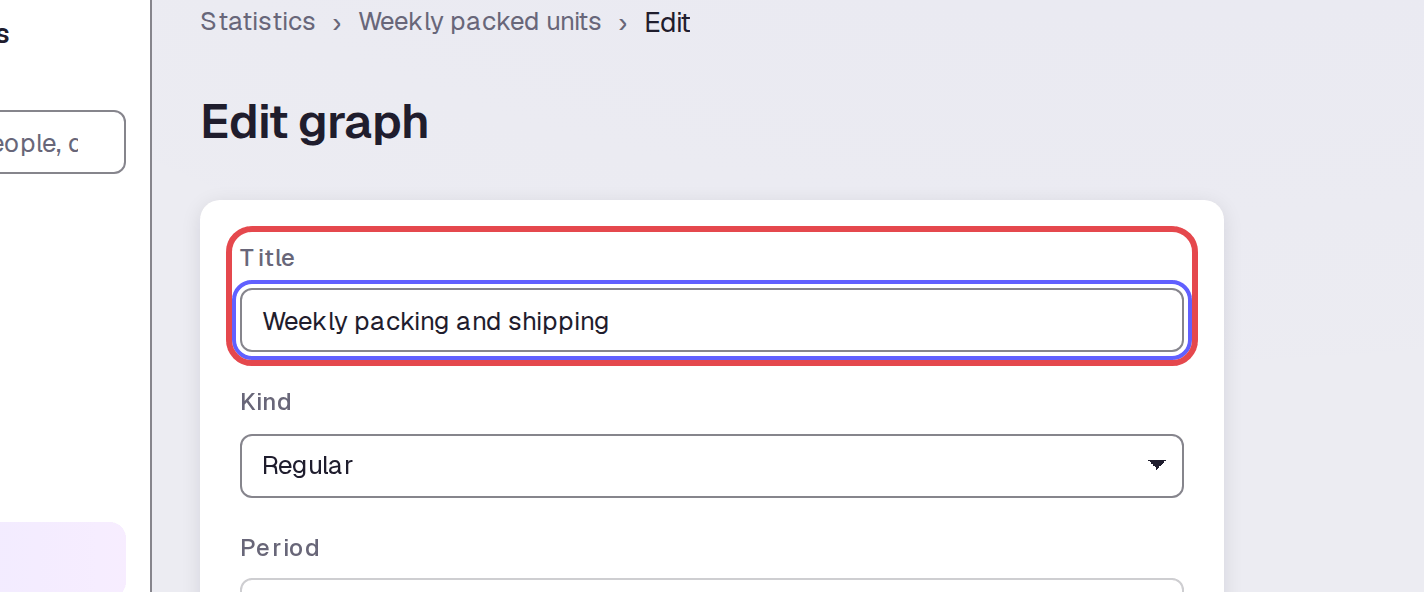
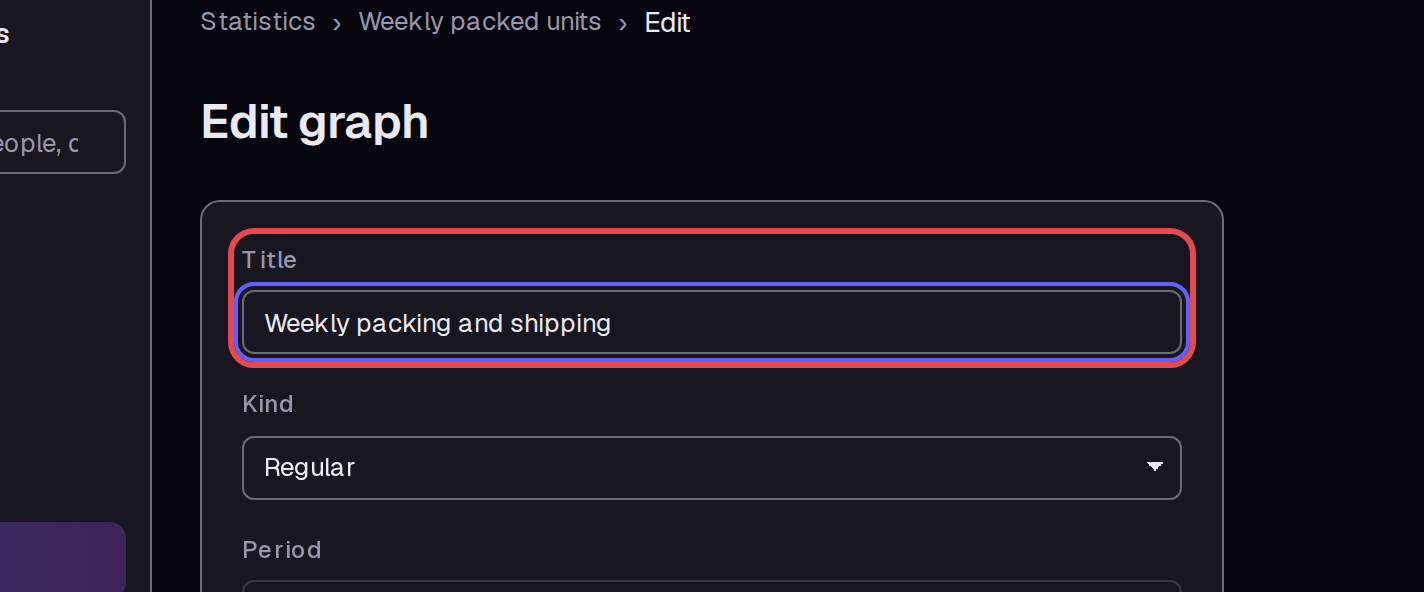
Click Edit graph. Change Title to “Weekly packing and shipping”.
Step 3 — Set a viability line
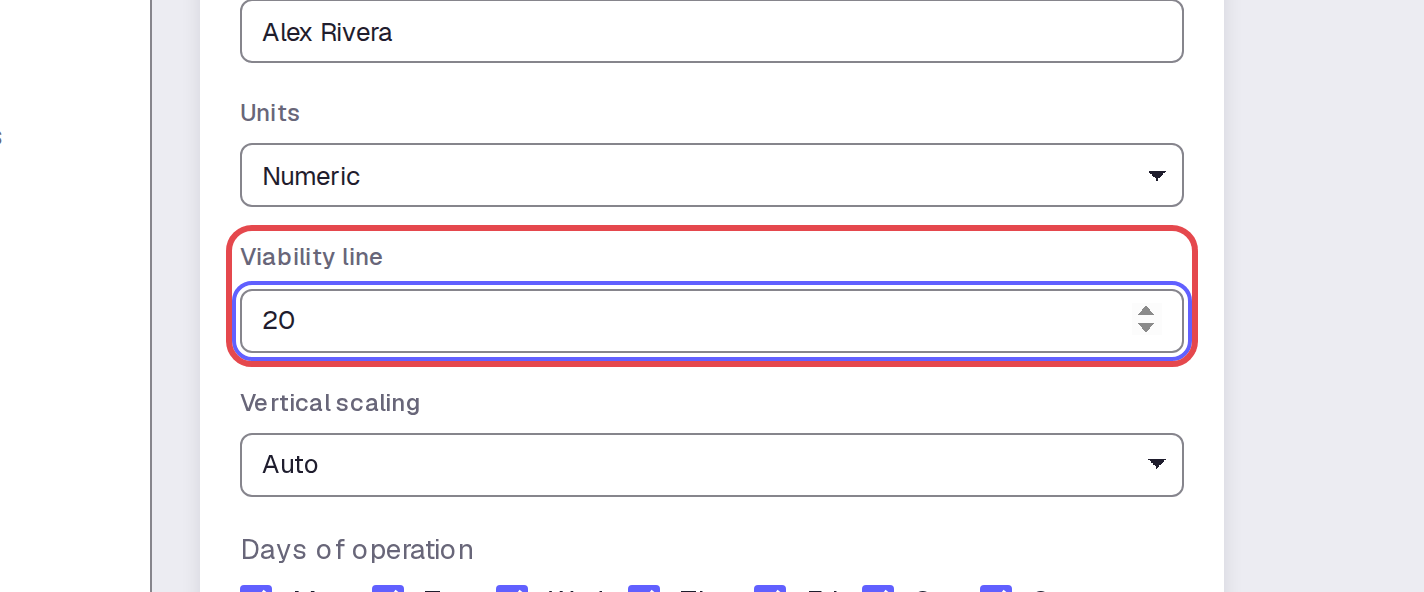
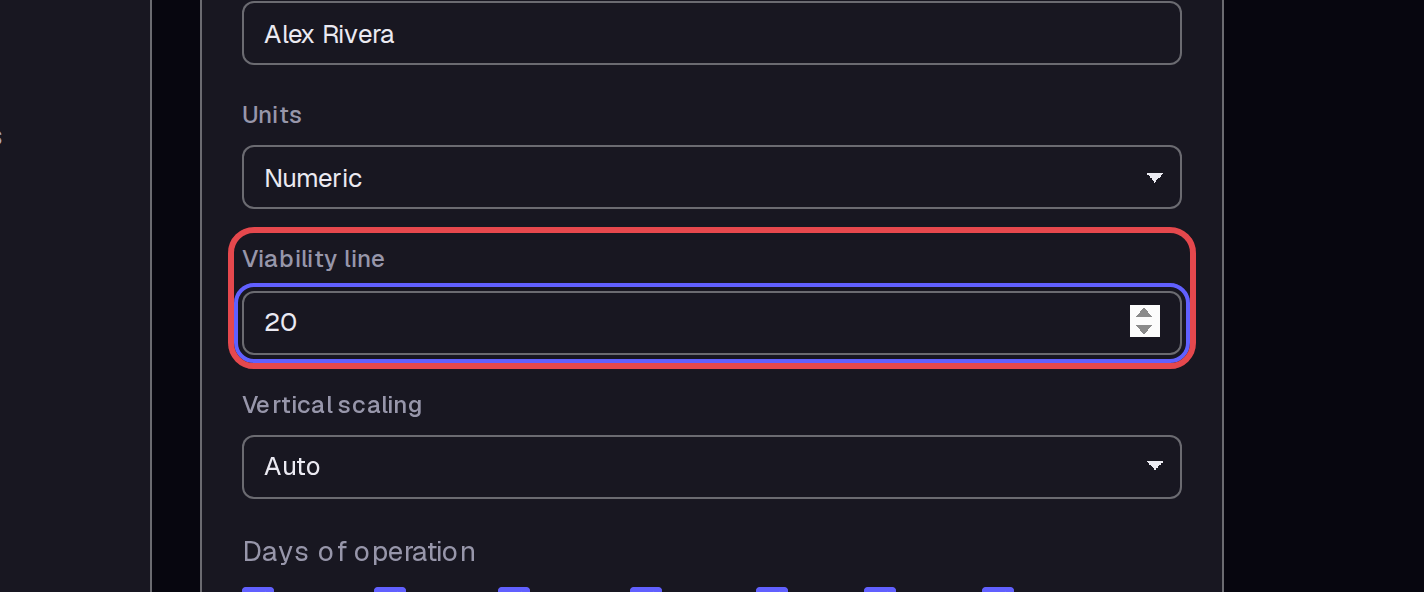
Enter “20” in Viability line. This adds a reference line to the graph after you save.
Step 4 — Set a weekly target
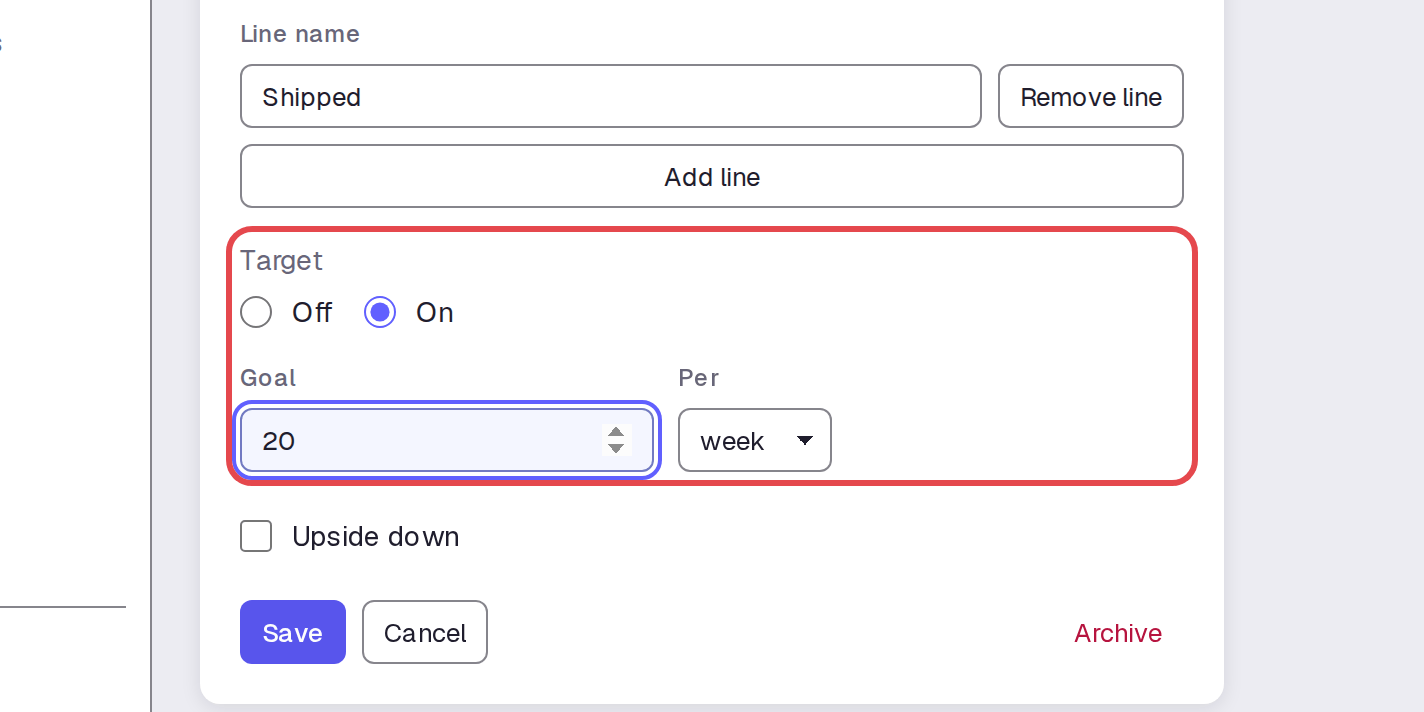
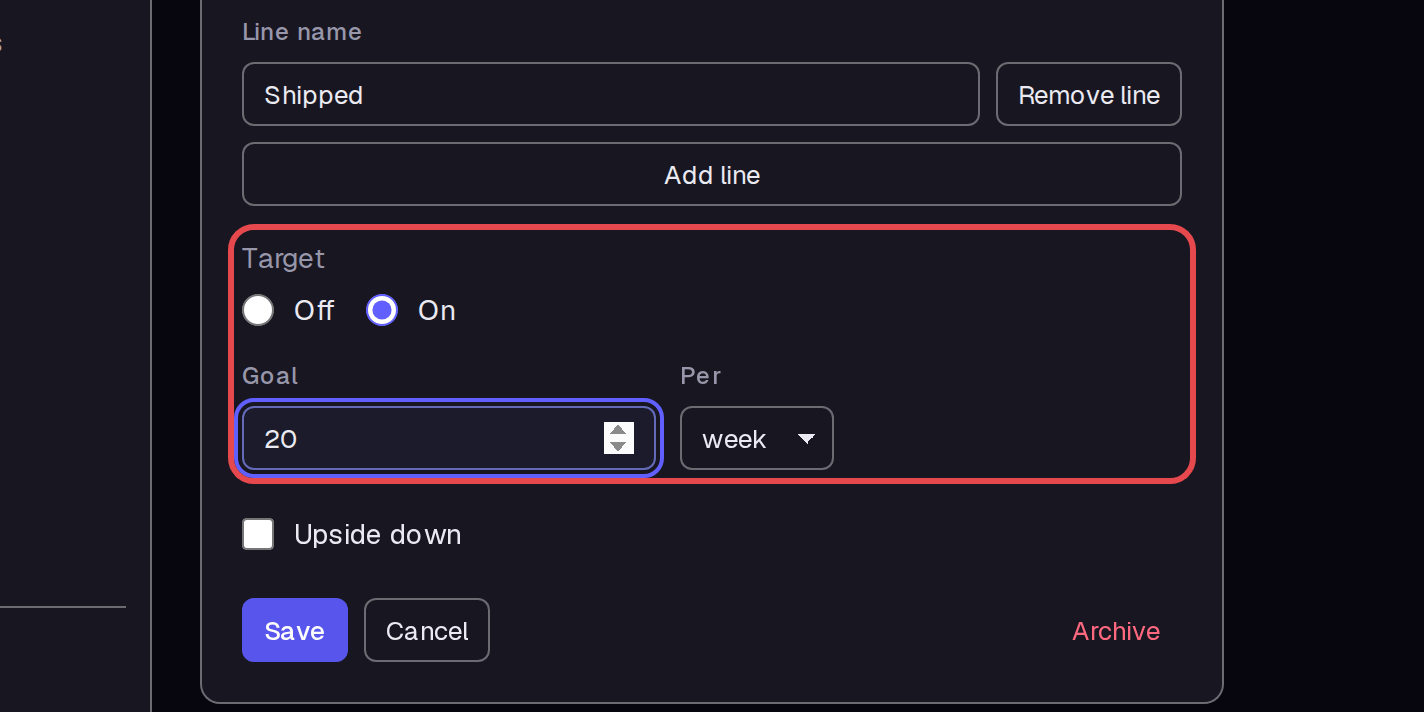
Under Target, select On. Enter “20” in Goal. Set Per to week.
Step 5 — Save the graph settings
Click Save. Check that the graph page shows the new title, “Weekly packing and shipping”.


Step 6 — Enter a value to check
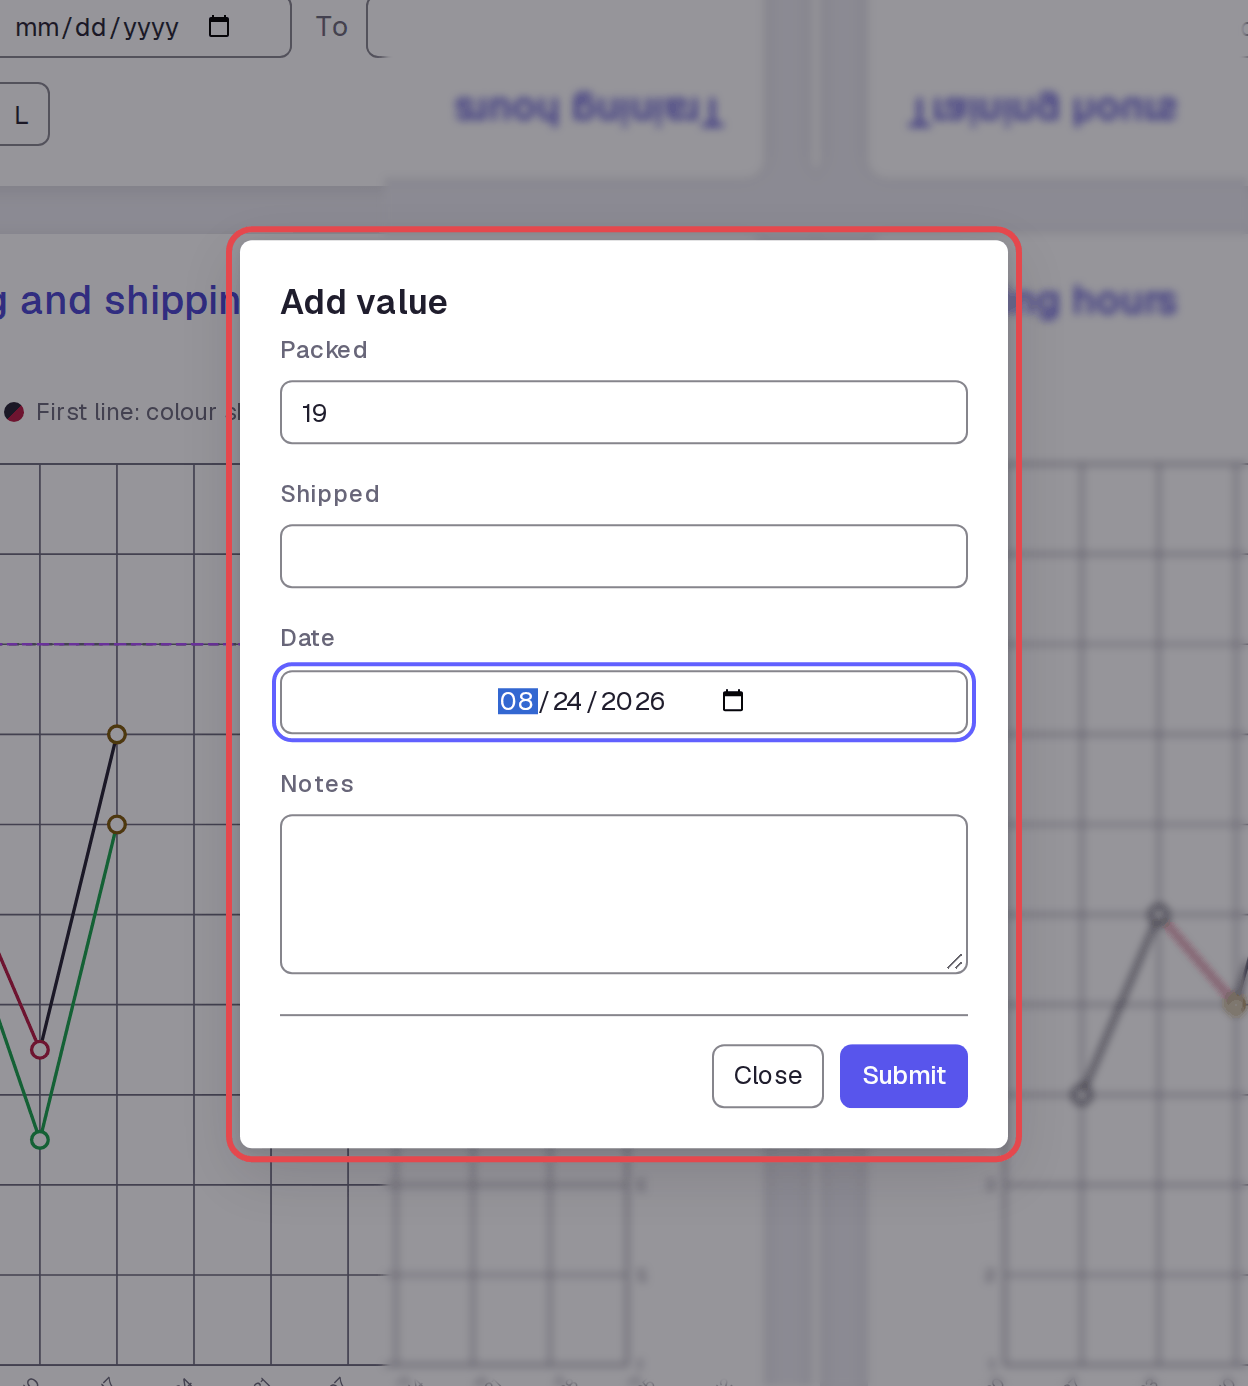
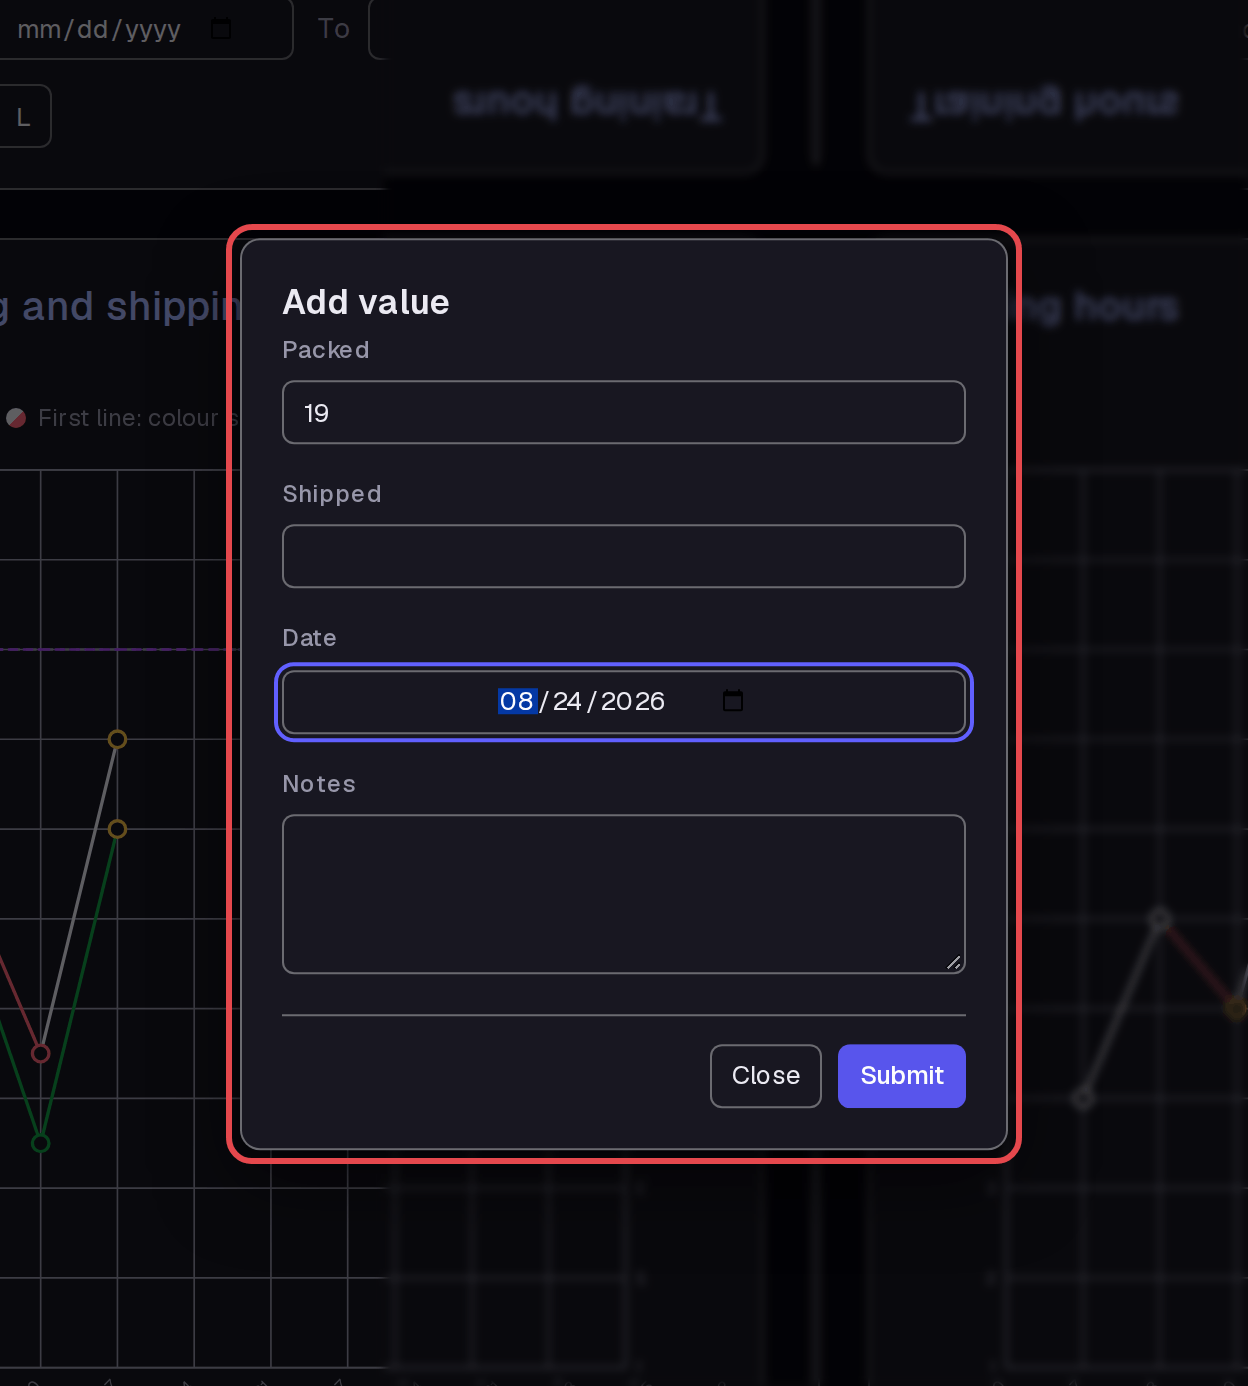
On Statistics, click the plus button labelled Add value on the renamed graph. Fill in “19” as Packed and August 24, 2026 as Date. Click Submit.
Step 7 — Correct the same value
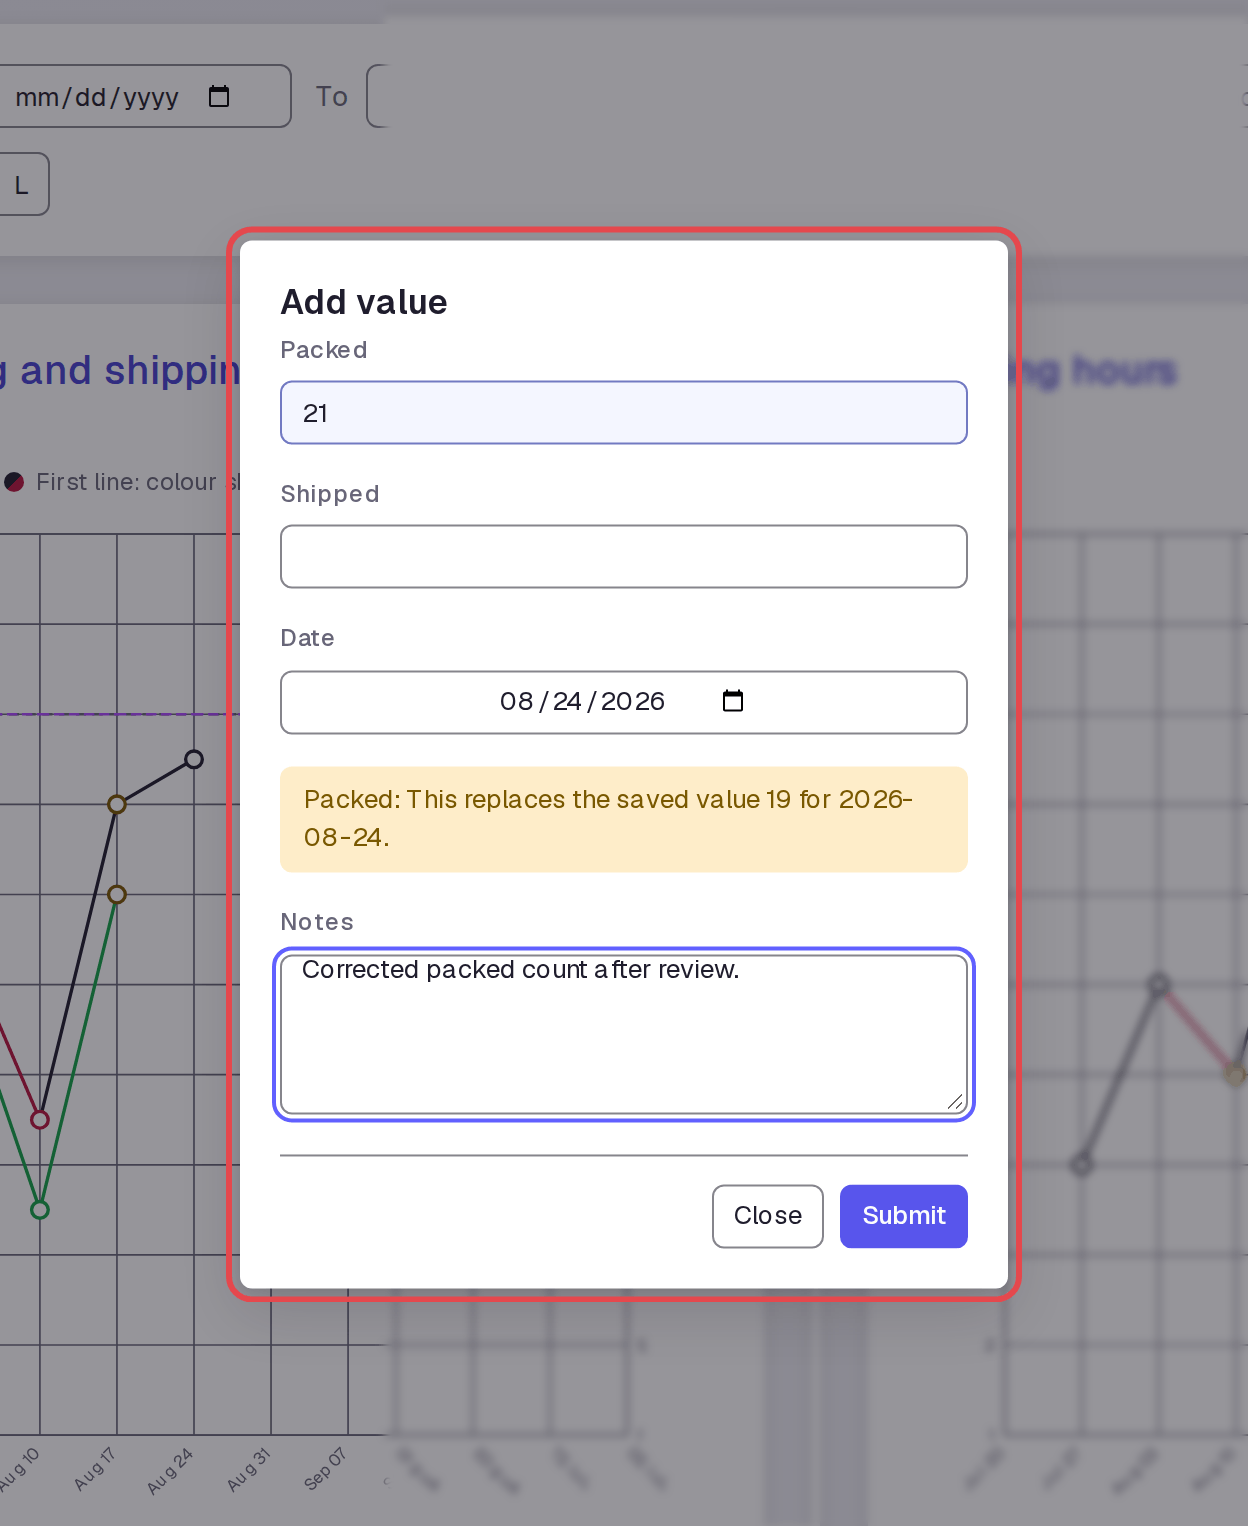
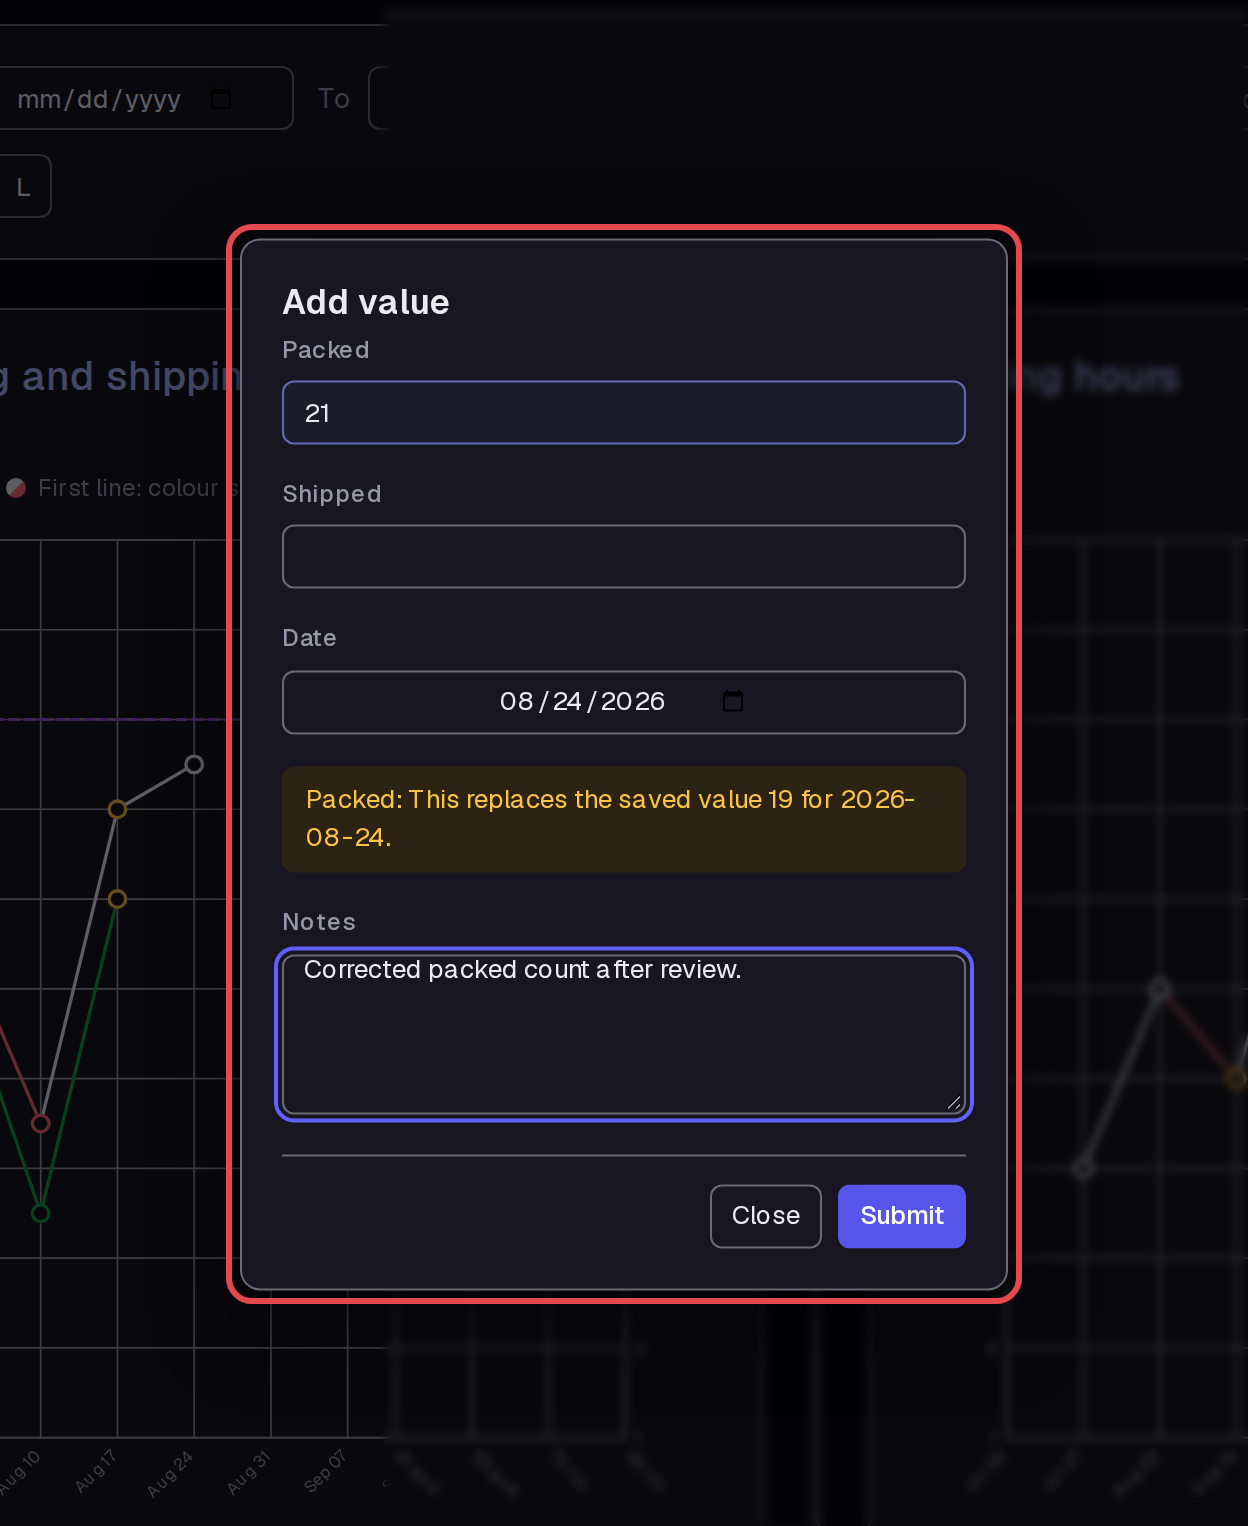
Open Add value again. Fill in “21” as Packed, August 24, 2026 as Date, and “Corrected packed count after review.” as Notes. Check the warning that this replaces the saved value 19 for that date. Click Submit.
Step 8 — Verify the correction
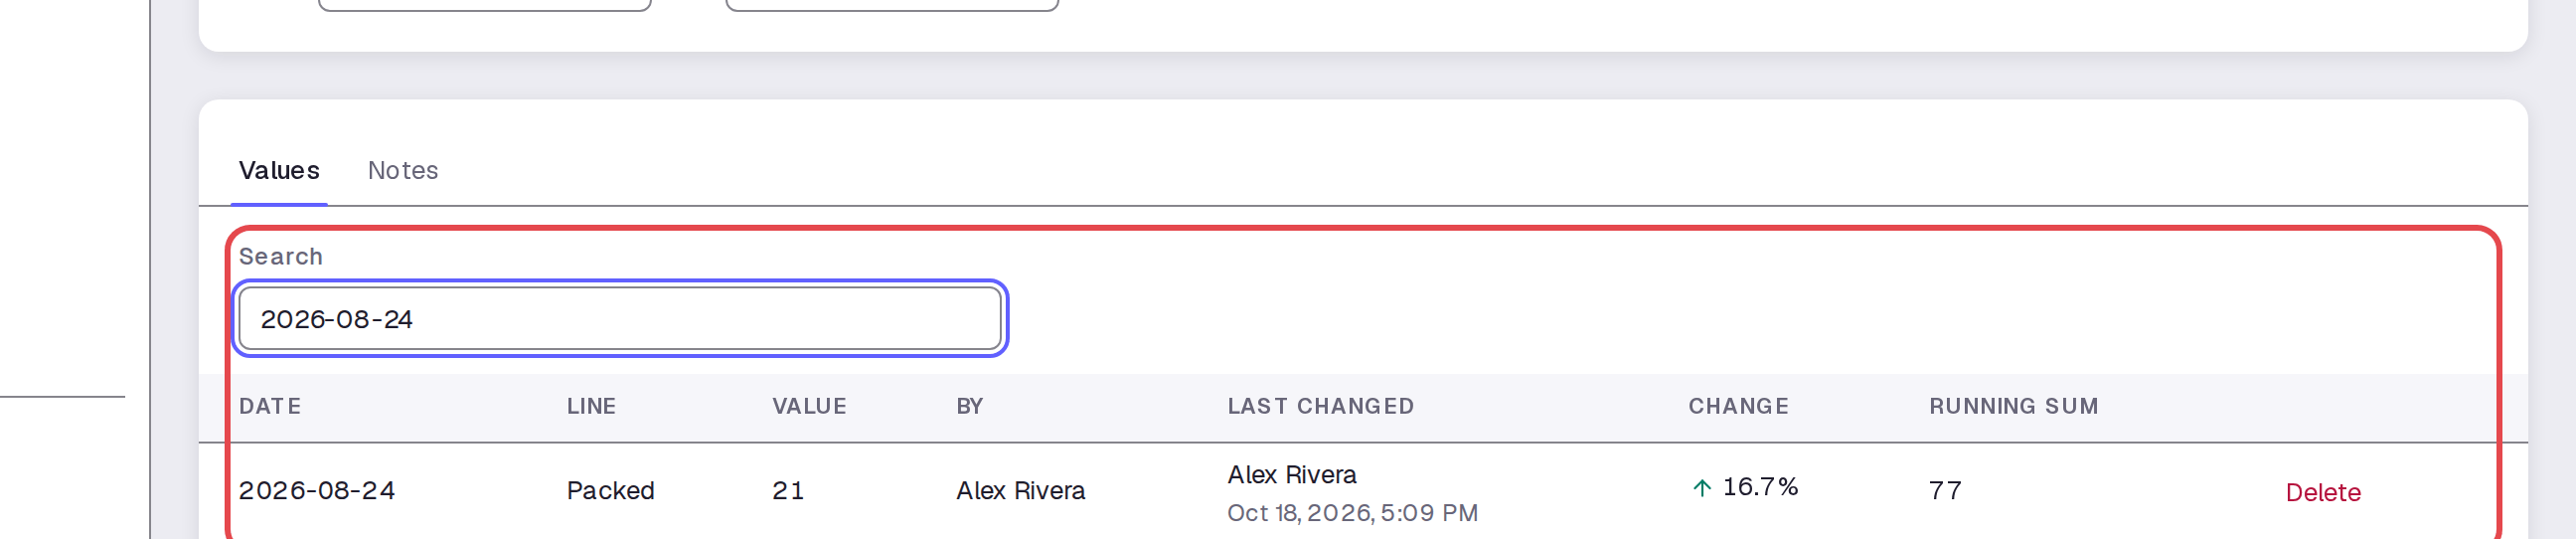
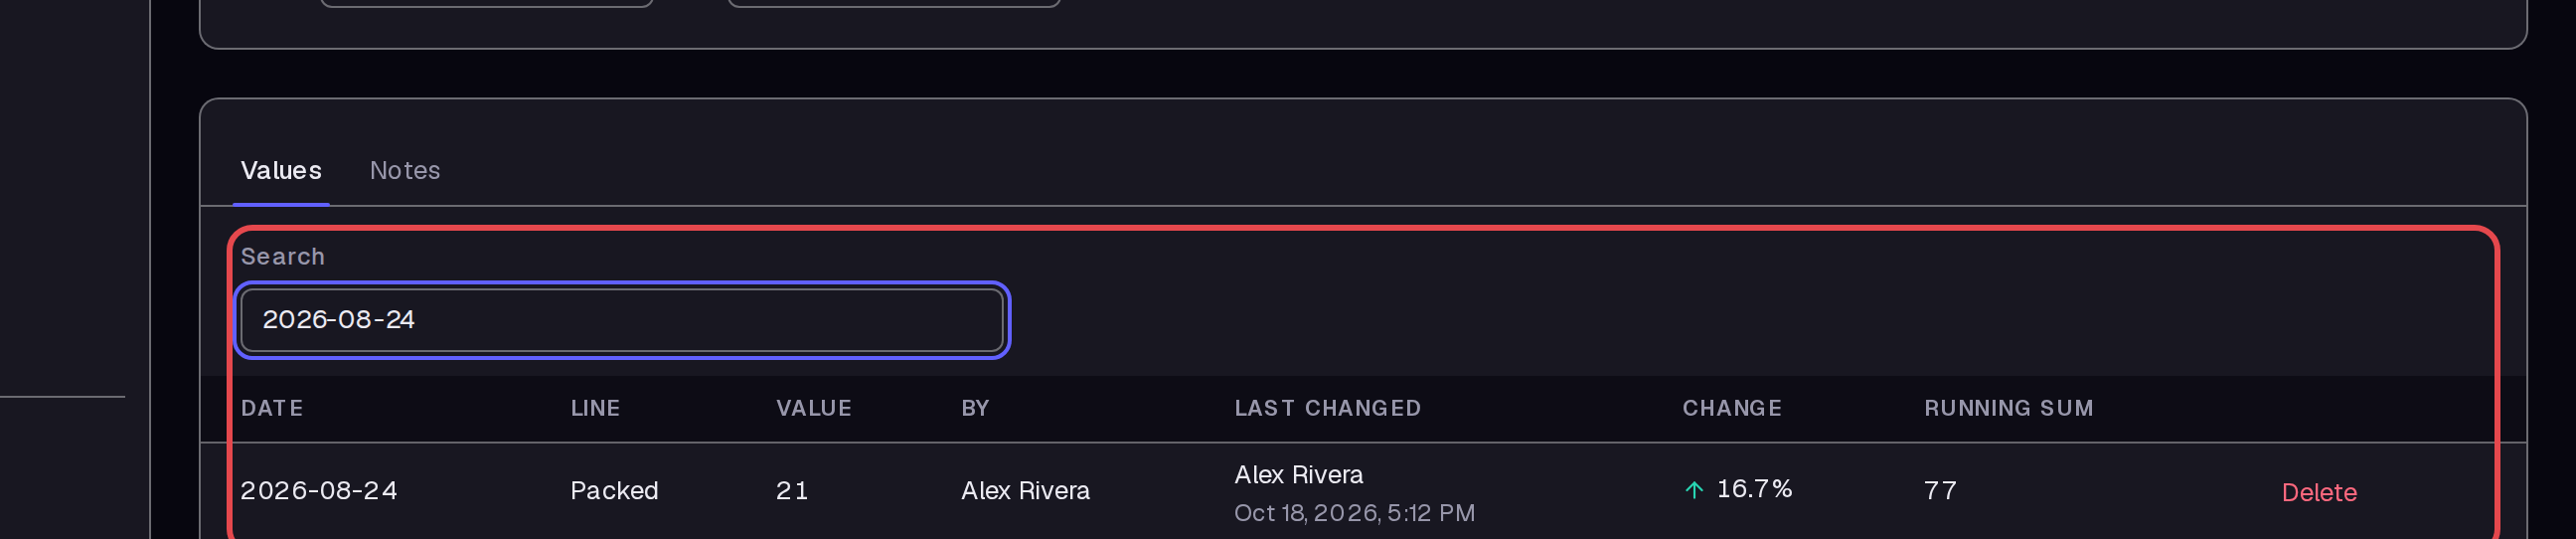
Open Weekly packing and shipping and select Values. Enter “2026-08-24” in Search. Check that one Packed row shows Value 21 and a Last changed entry.
Step 9 — Read the note
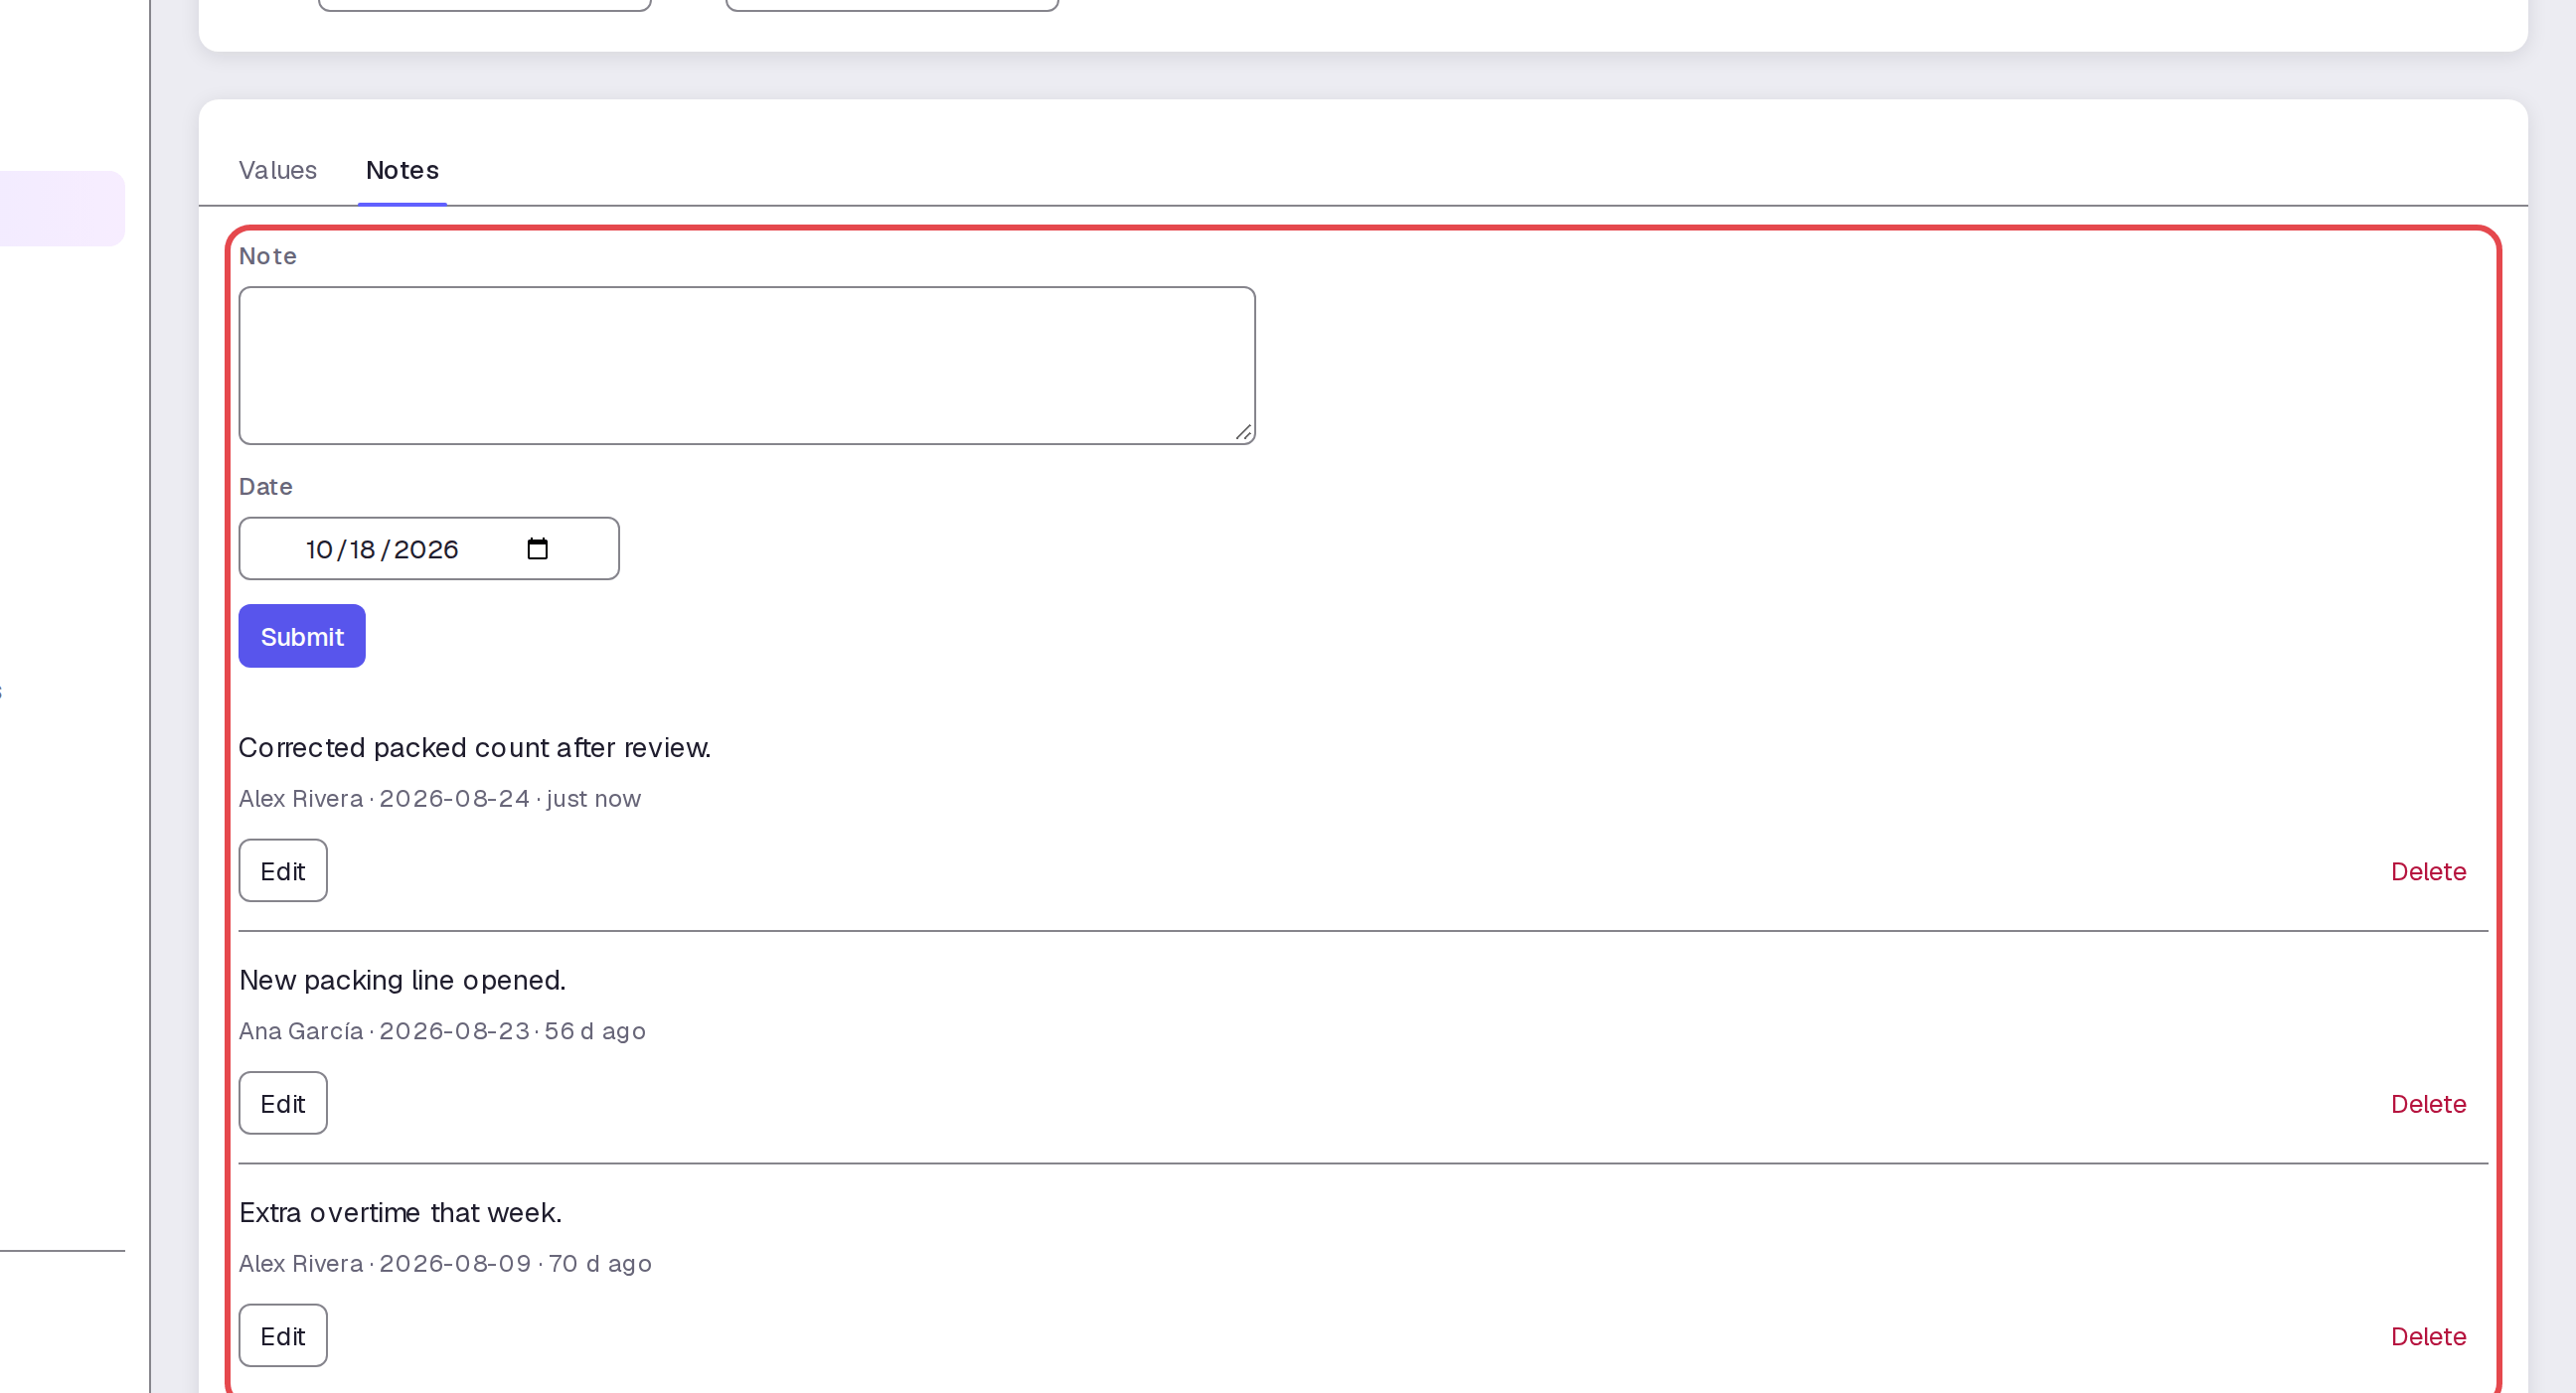
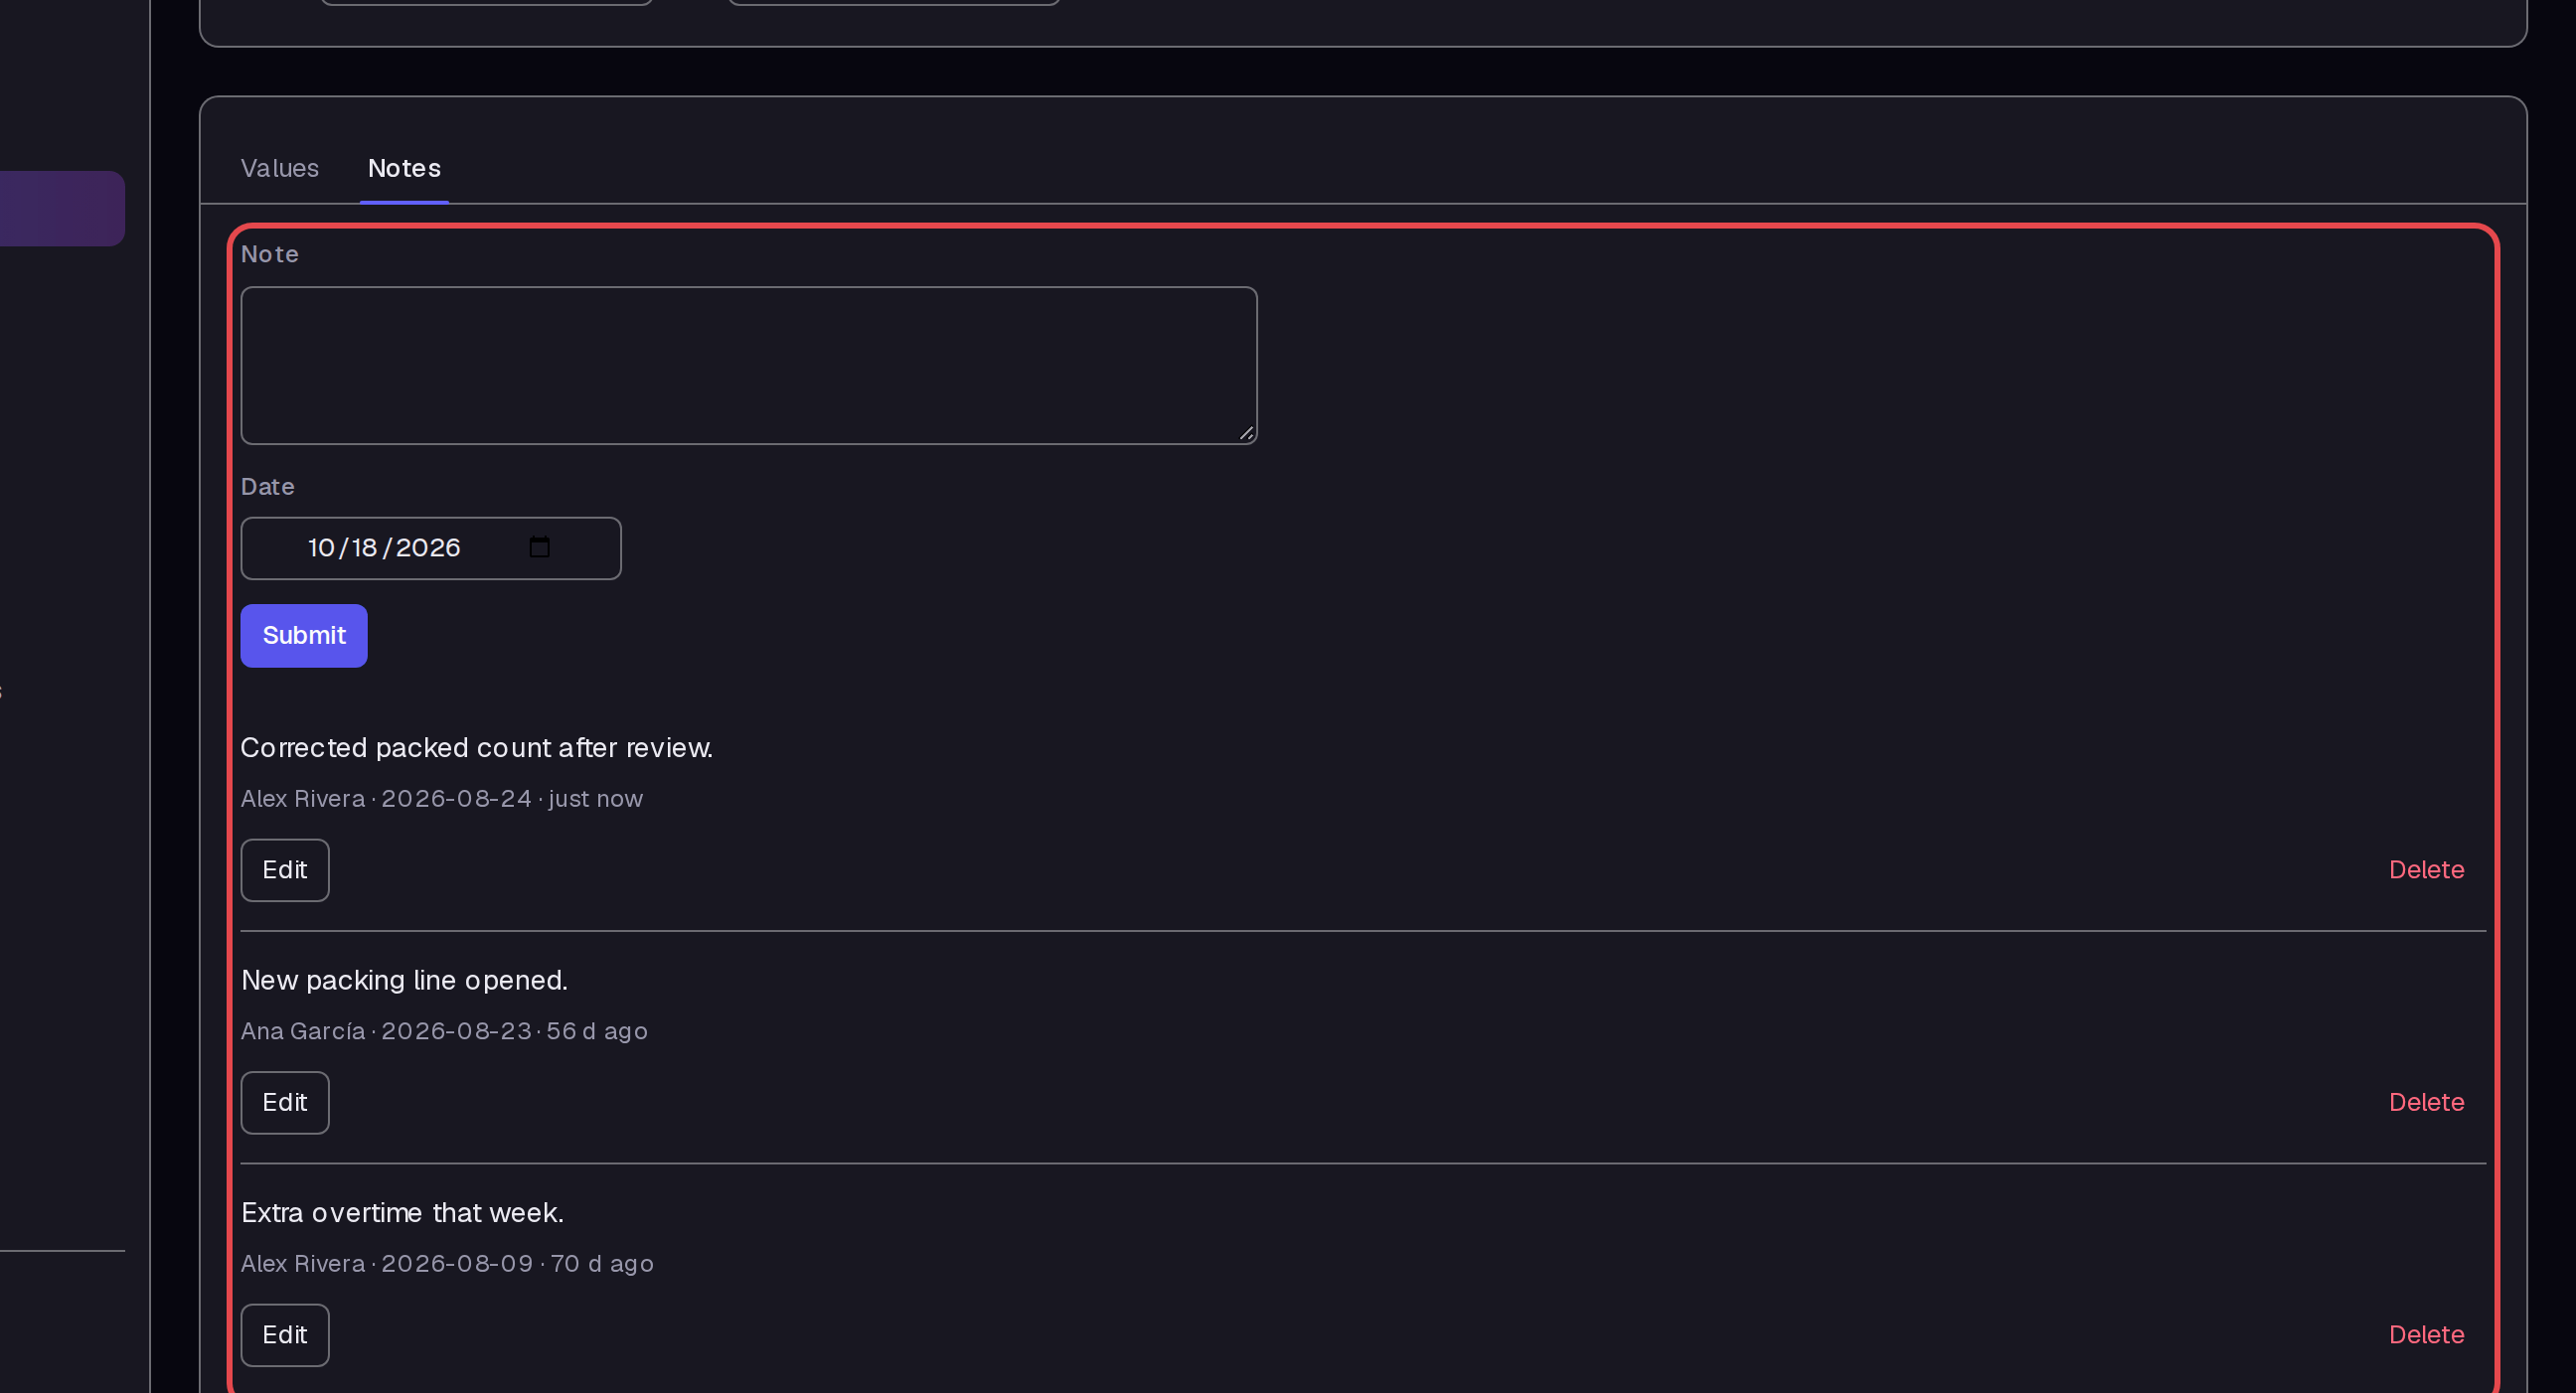
Select Notes. Check that “Corrected packed count after review.” appears with its date and author.
Step 10 — Set the comparison date range
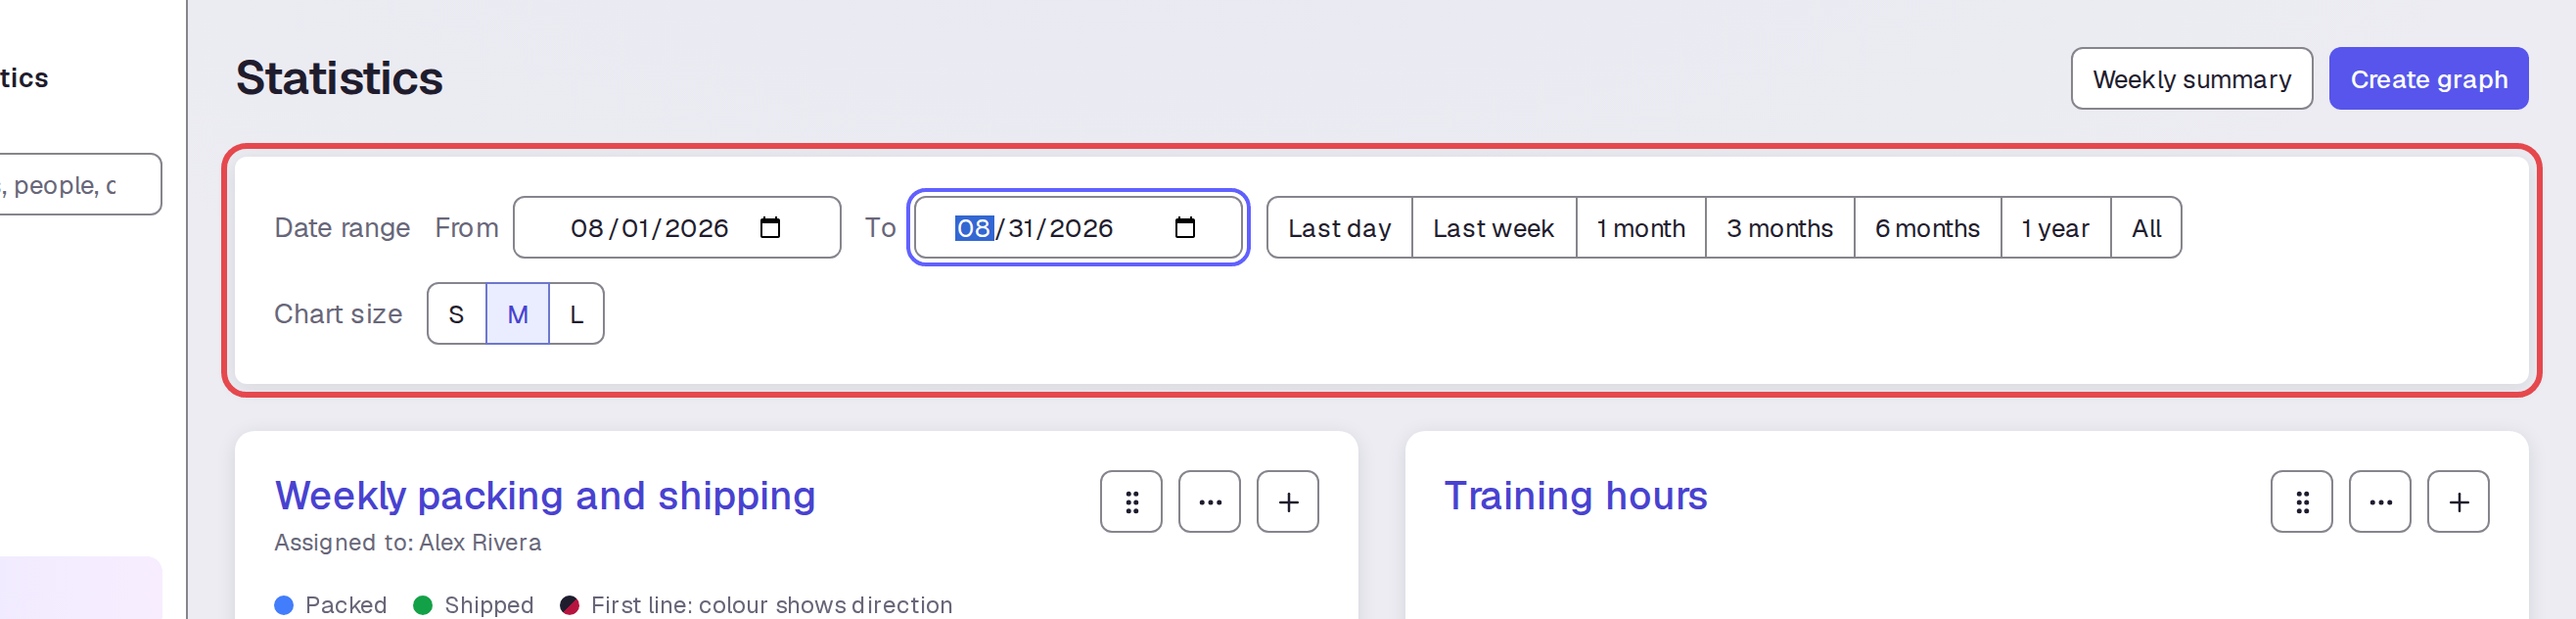
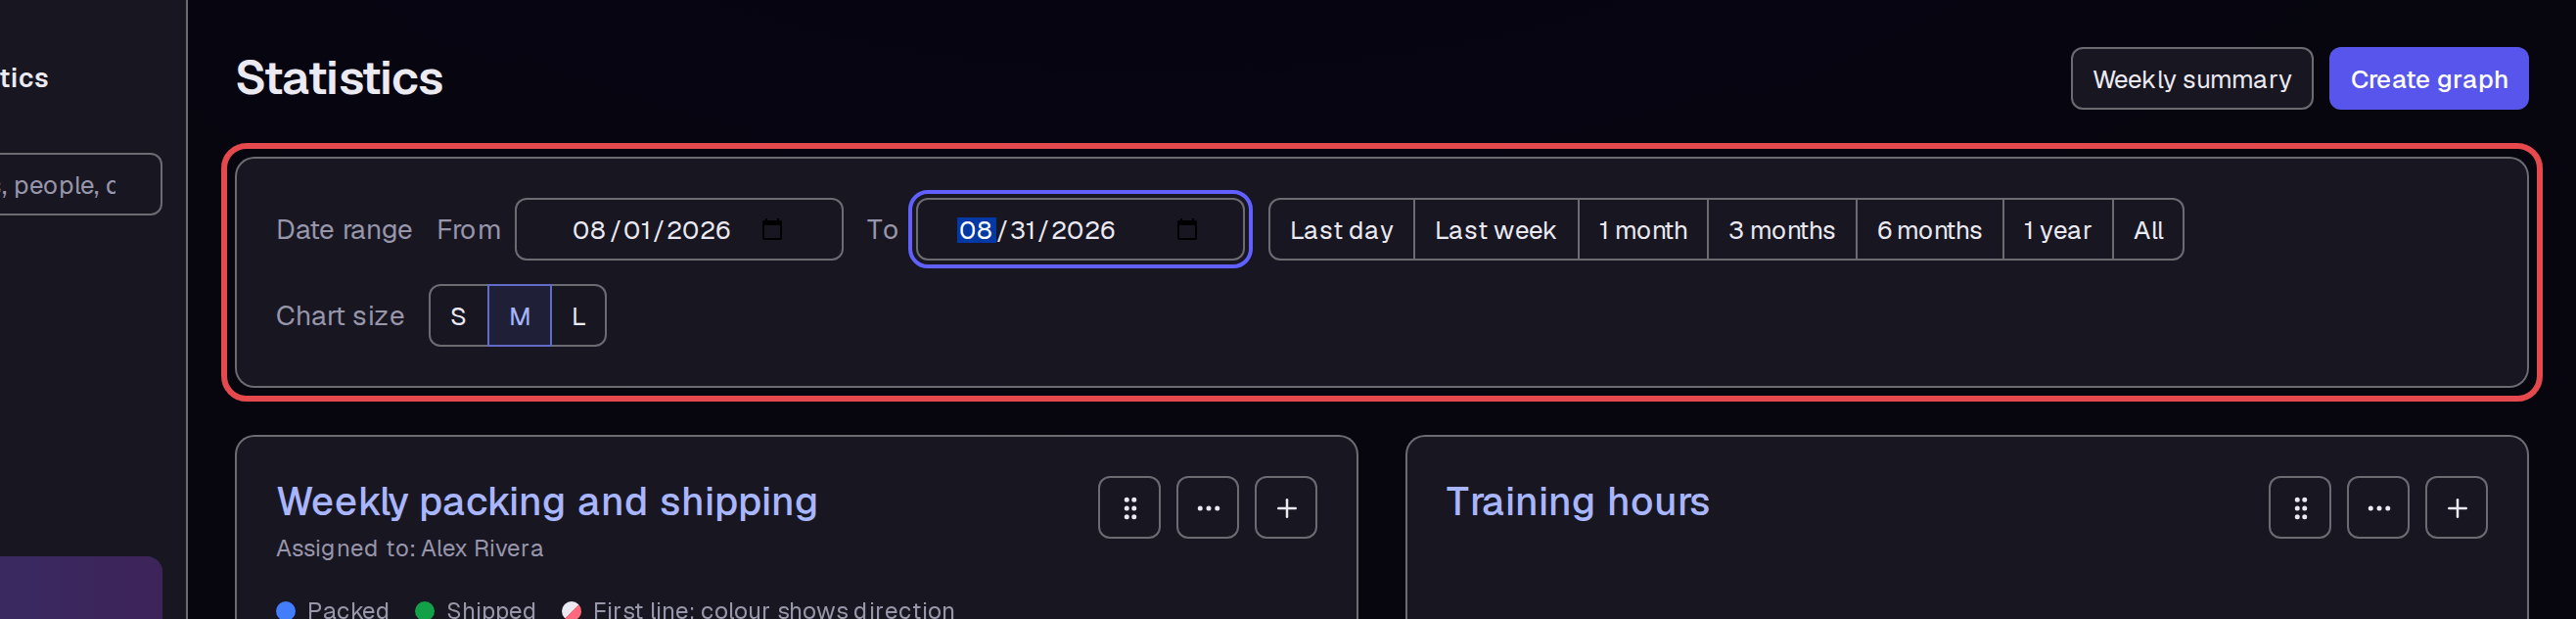
Return to Statistics. In the top Date range controls, set From to August 1, 2026. Set To to August 31, 2026.
Step 11 — Compare two graphs
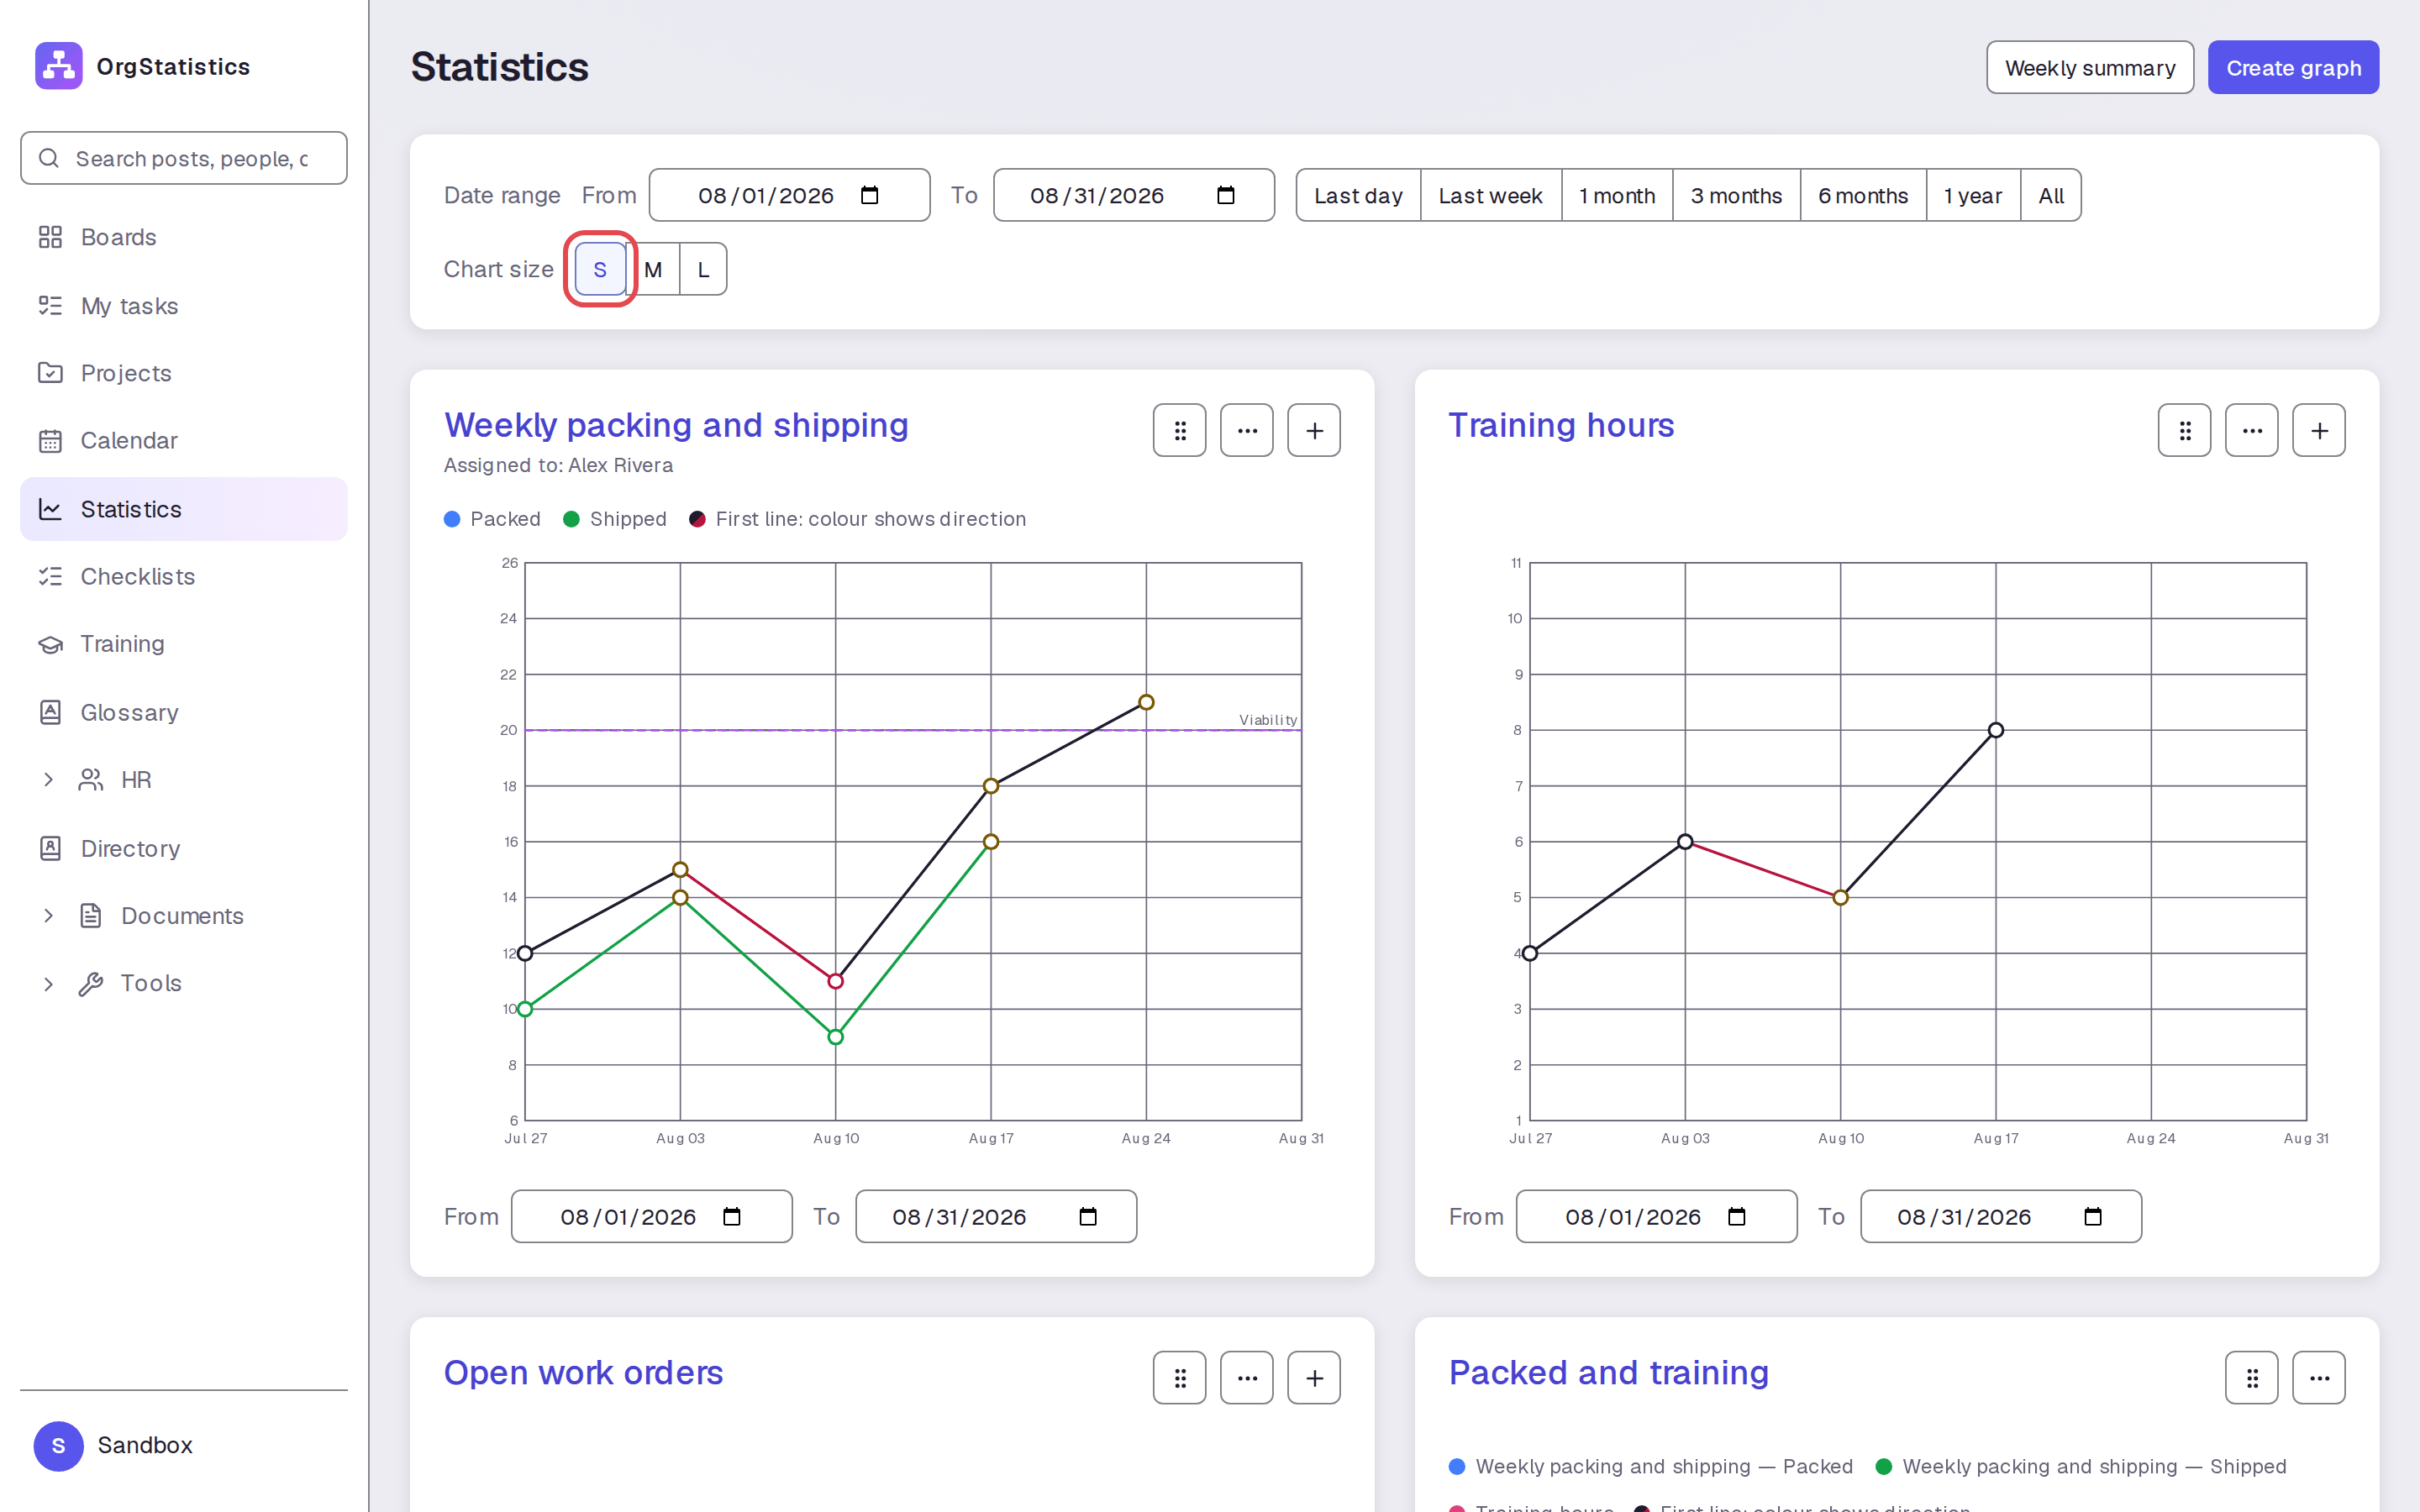
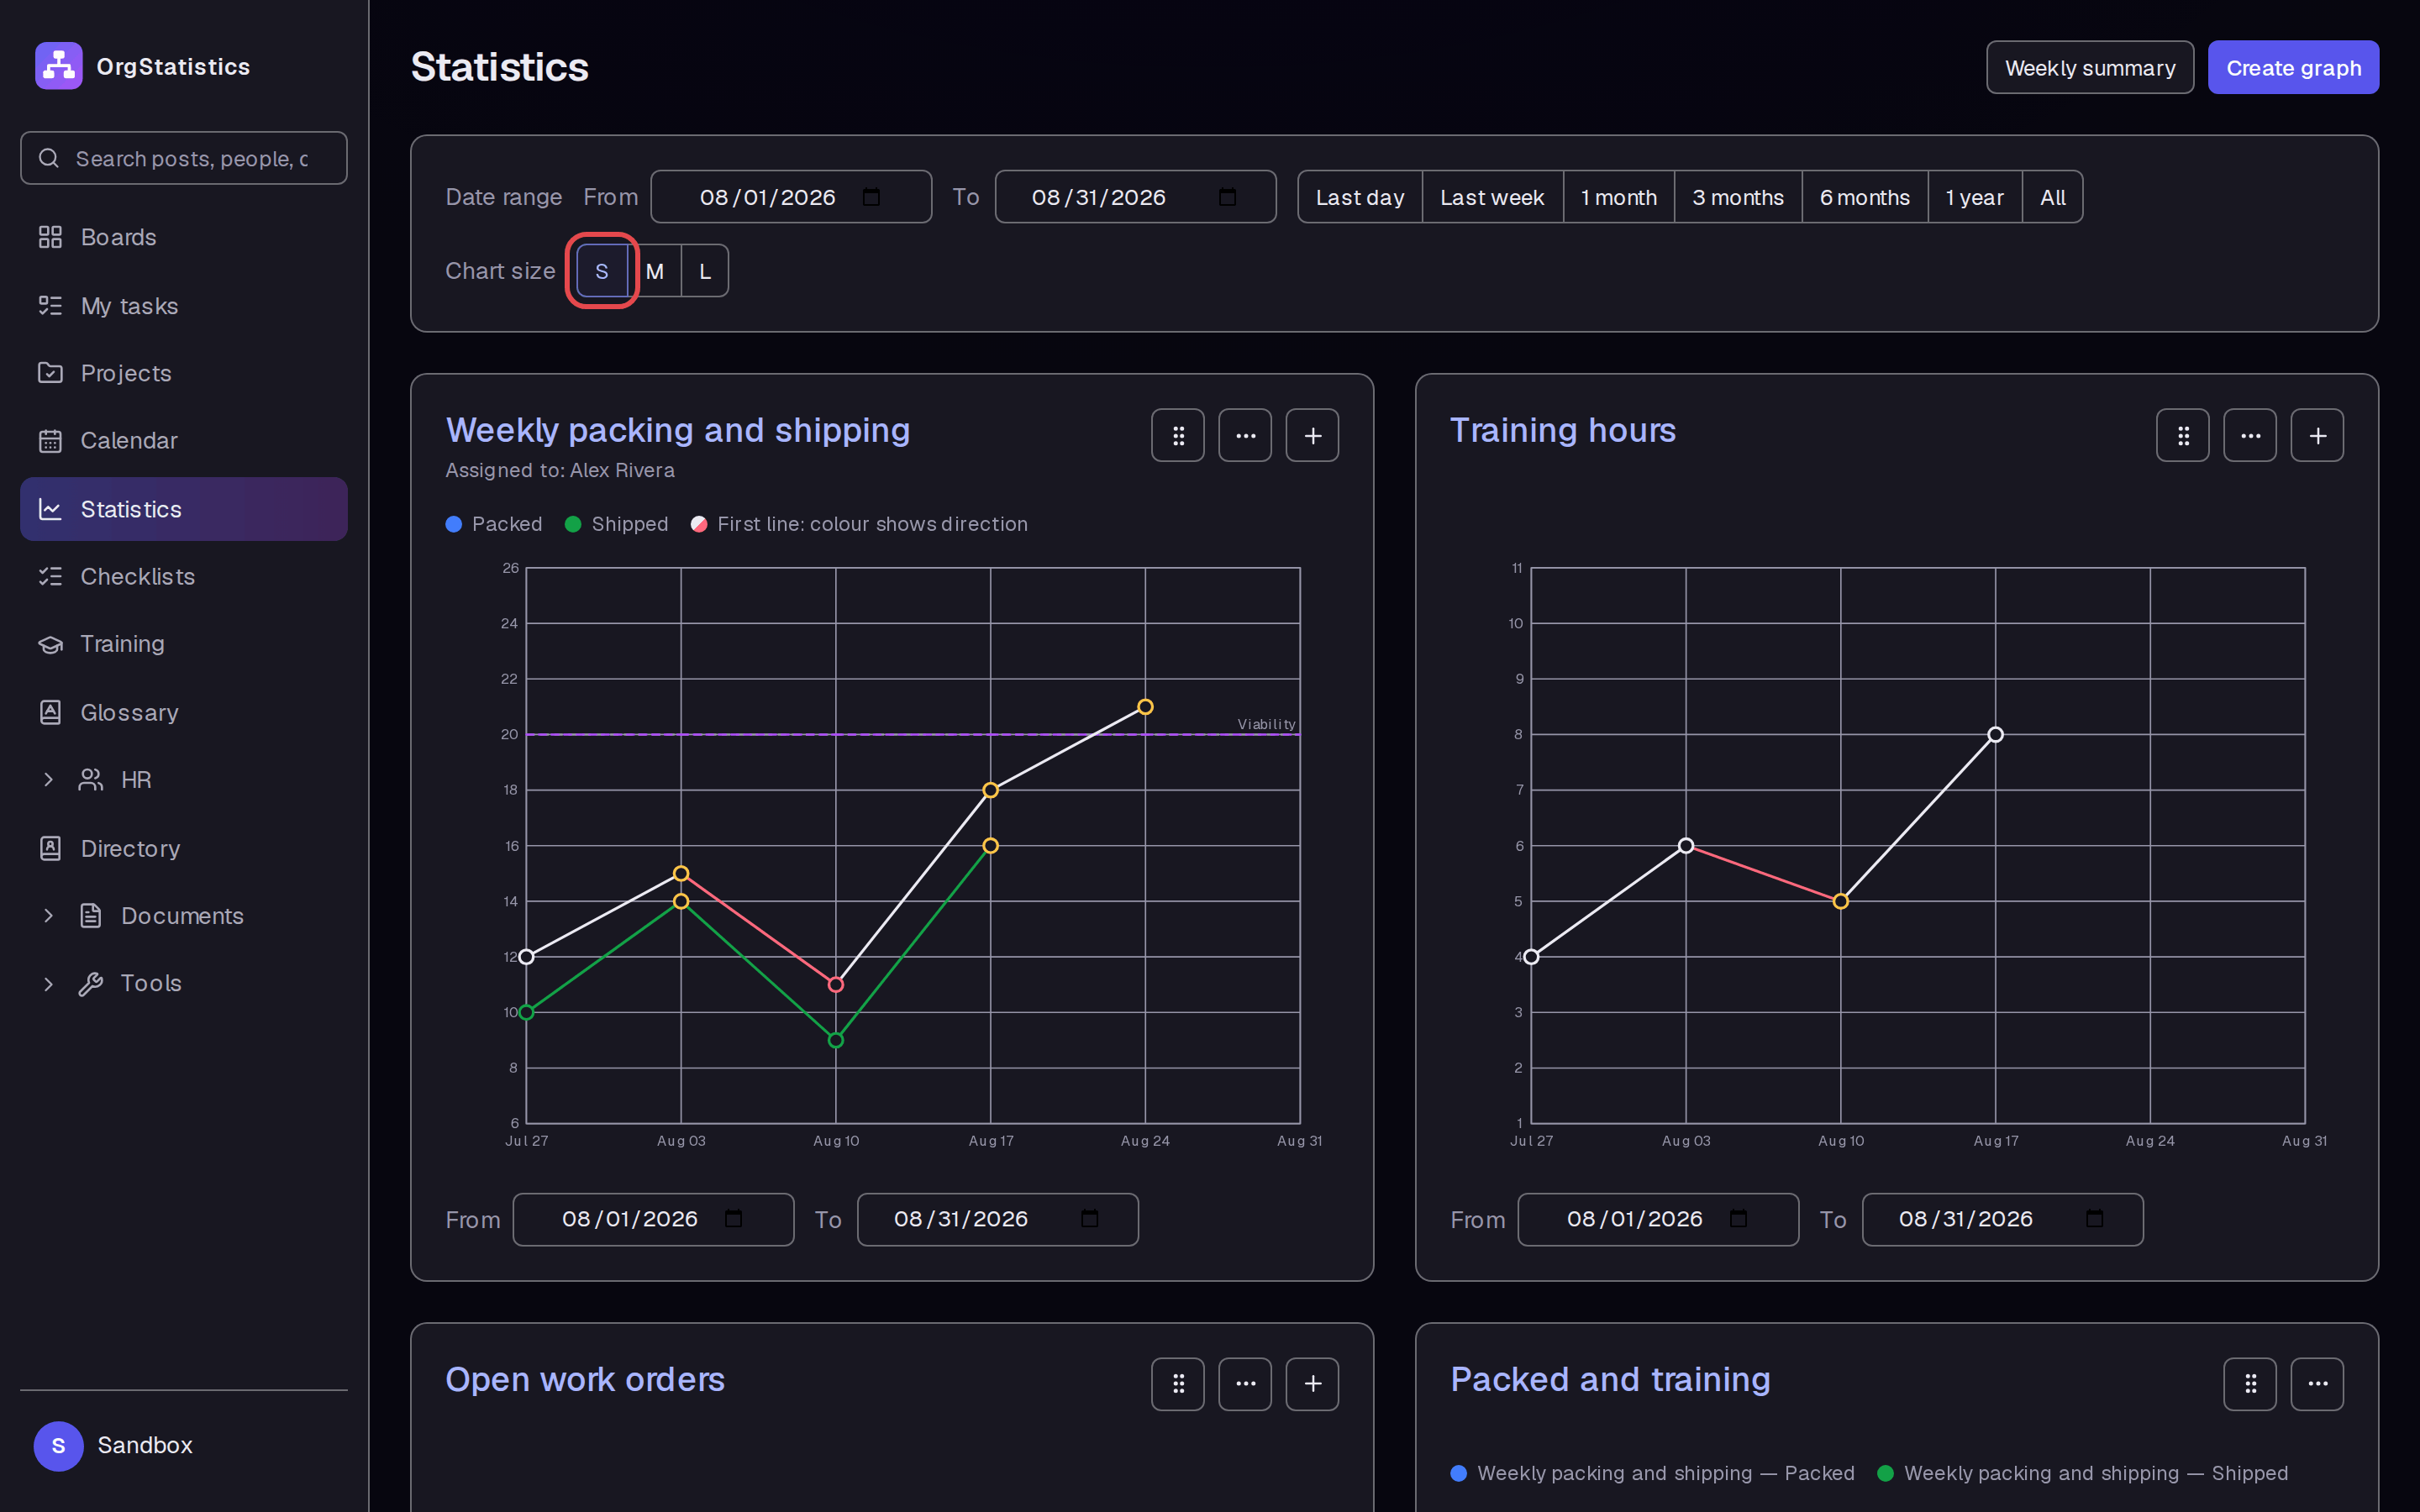
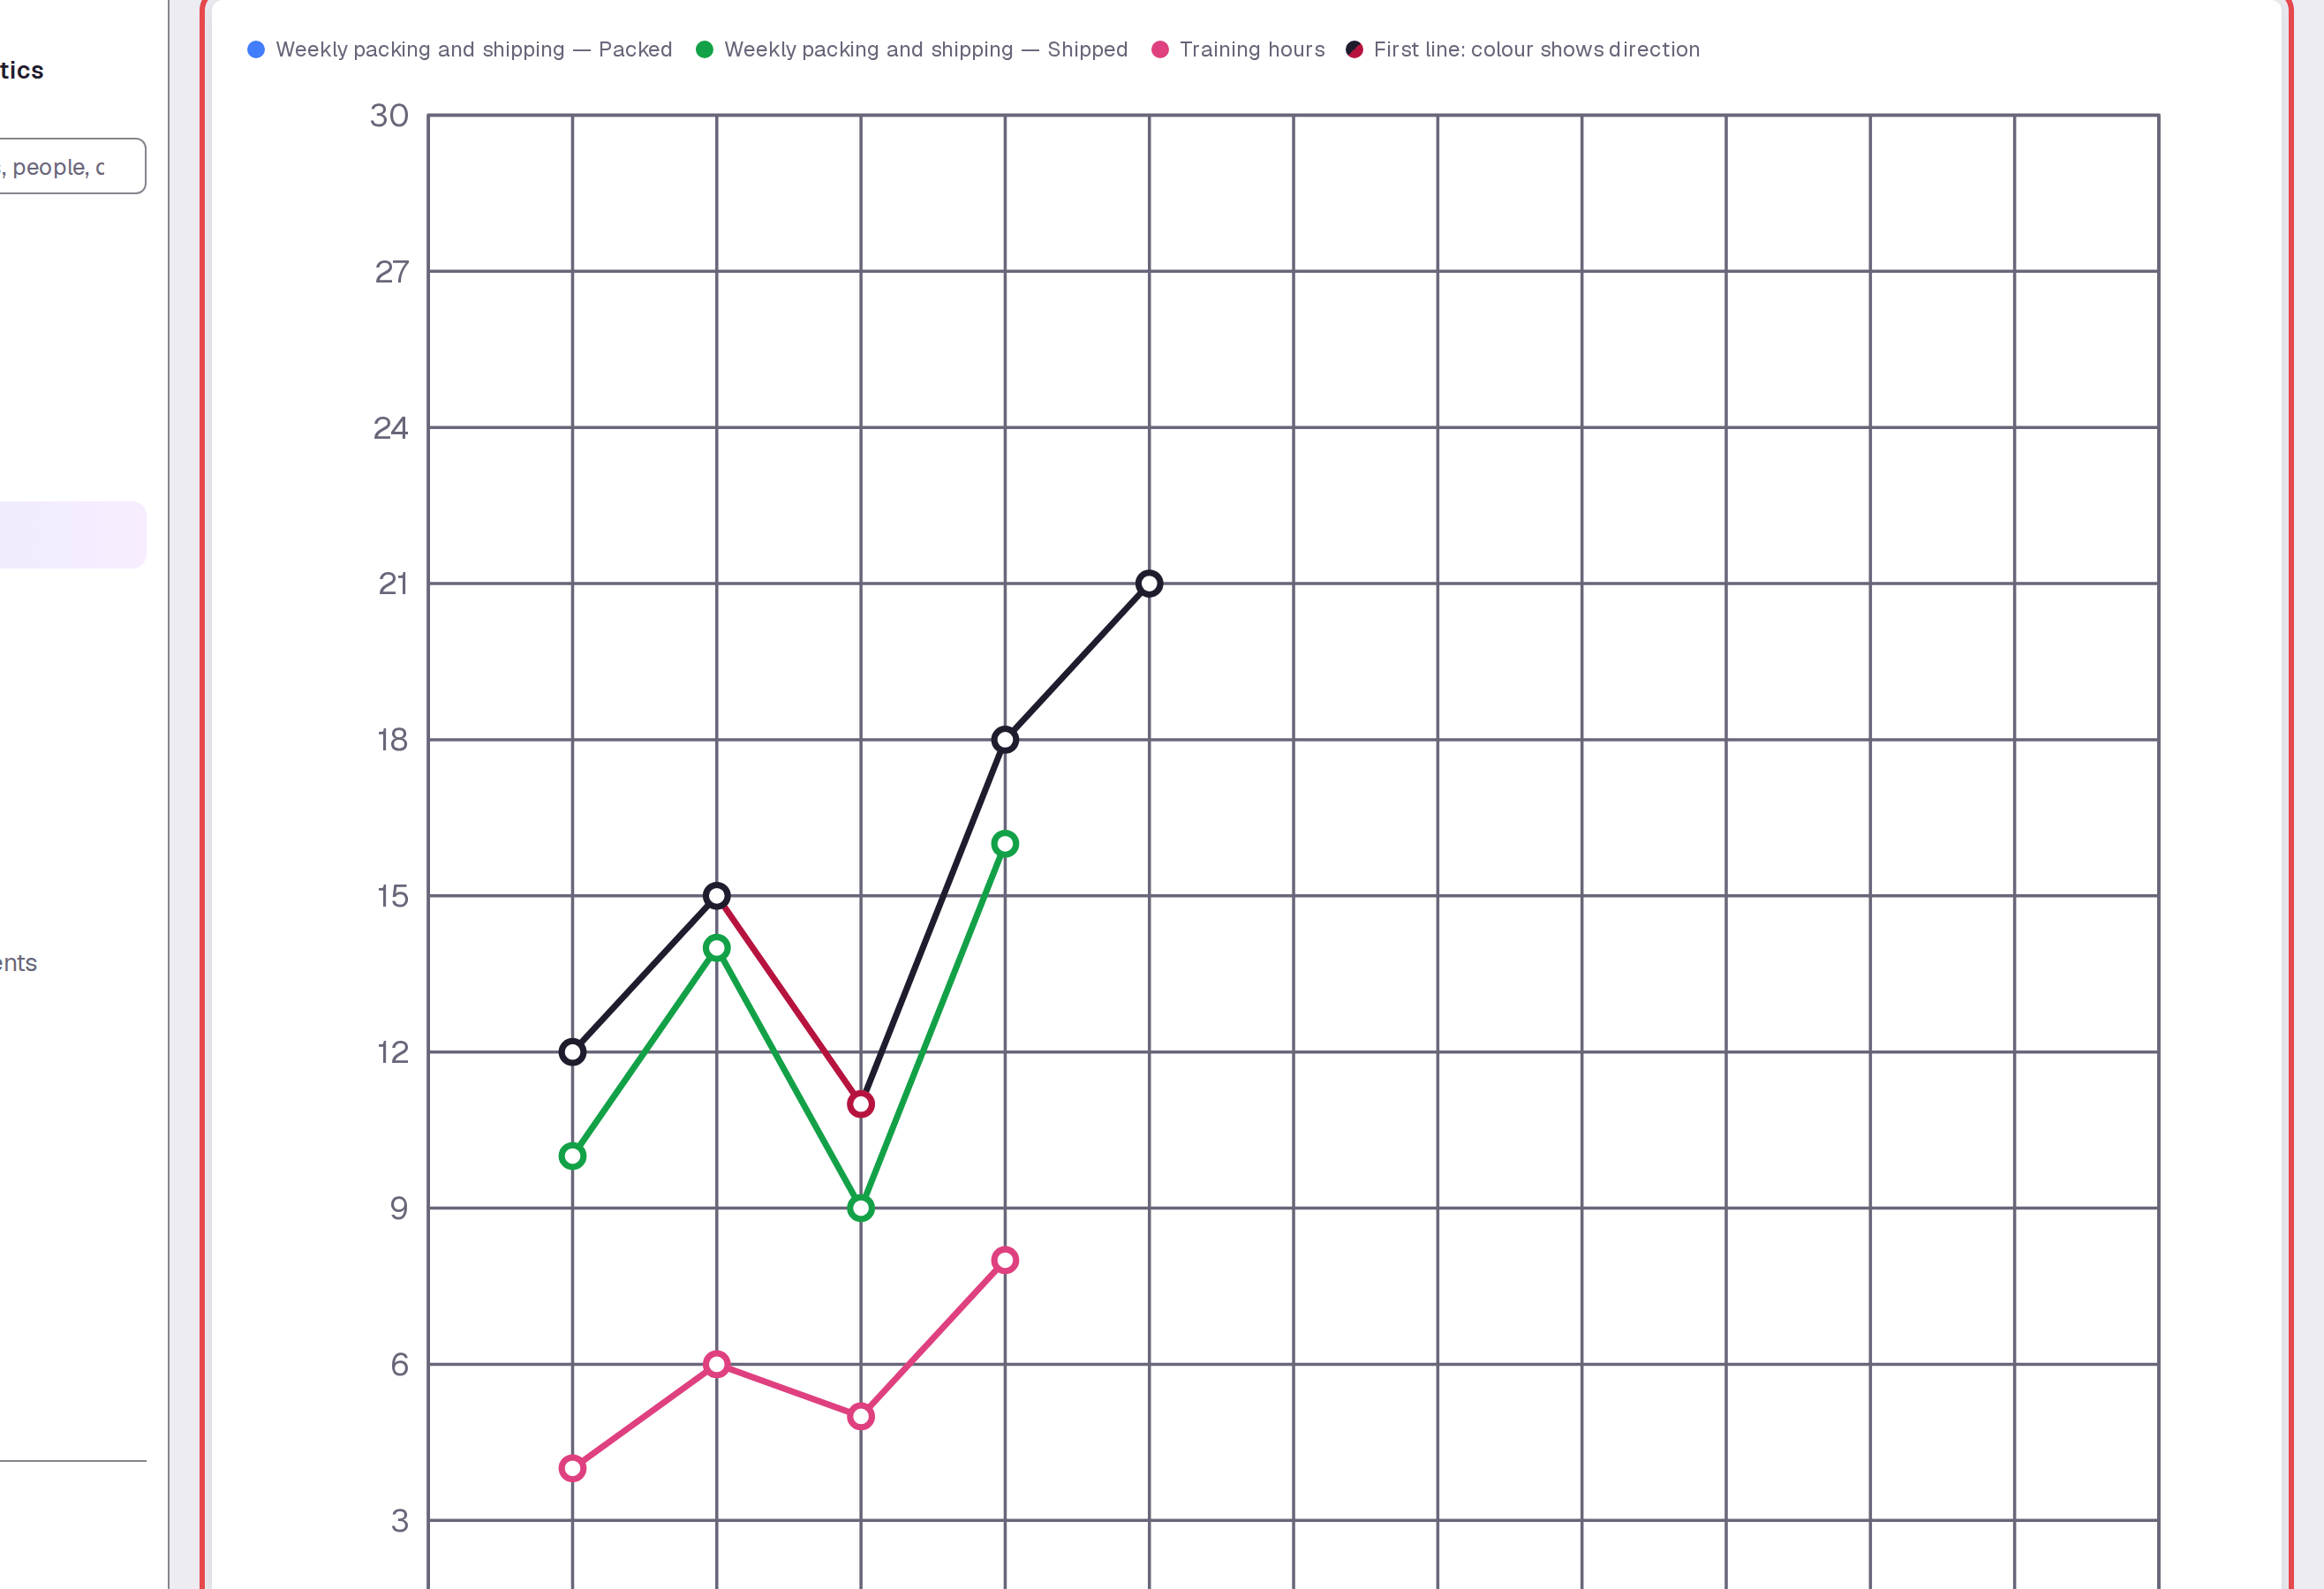
Under Chart size, select S. Compare Weekly packing and shipping with Training hours beside it. Read each graph's own vertical scale when you compare the lines.
Step 12 — Read a linked comparison graph
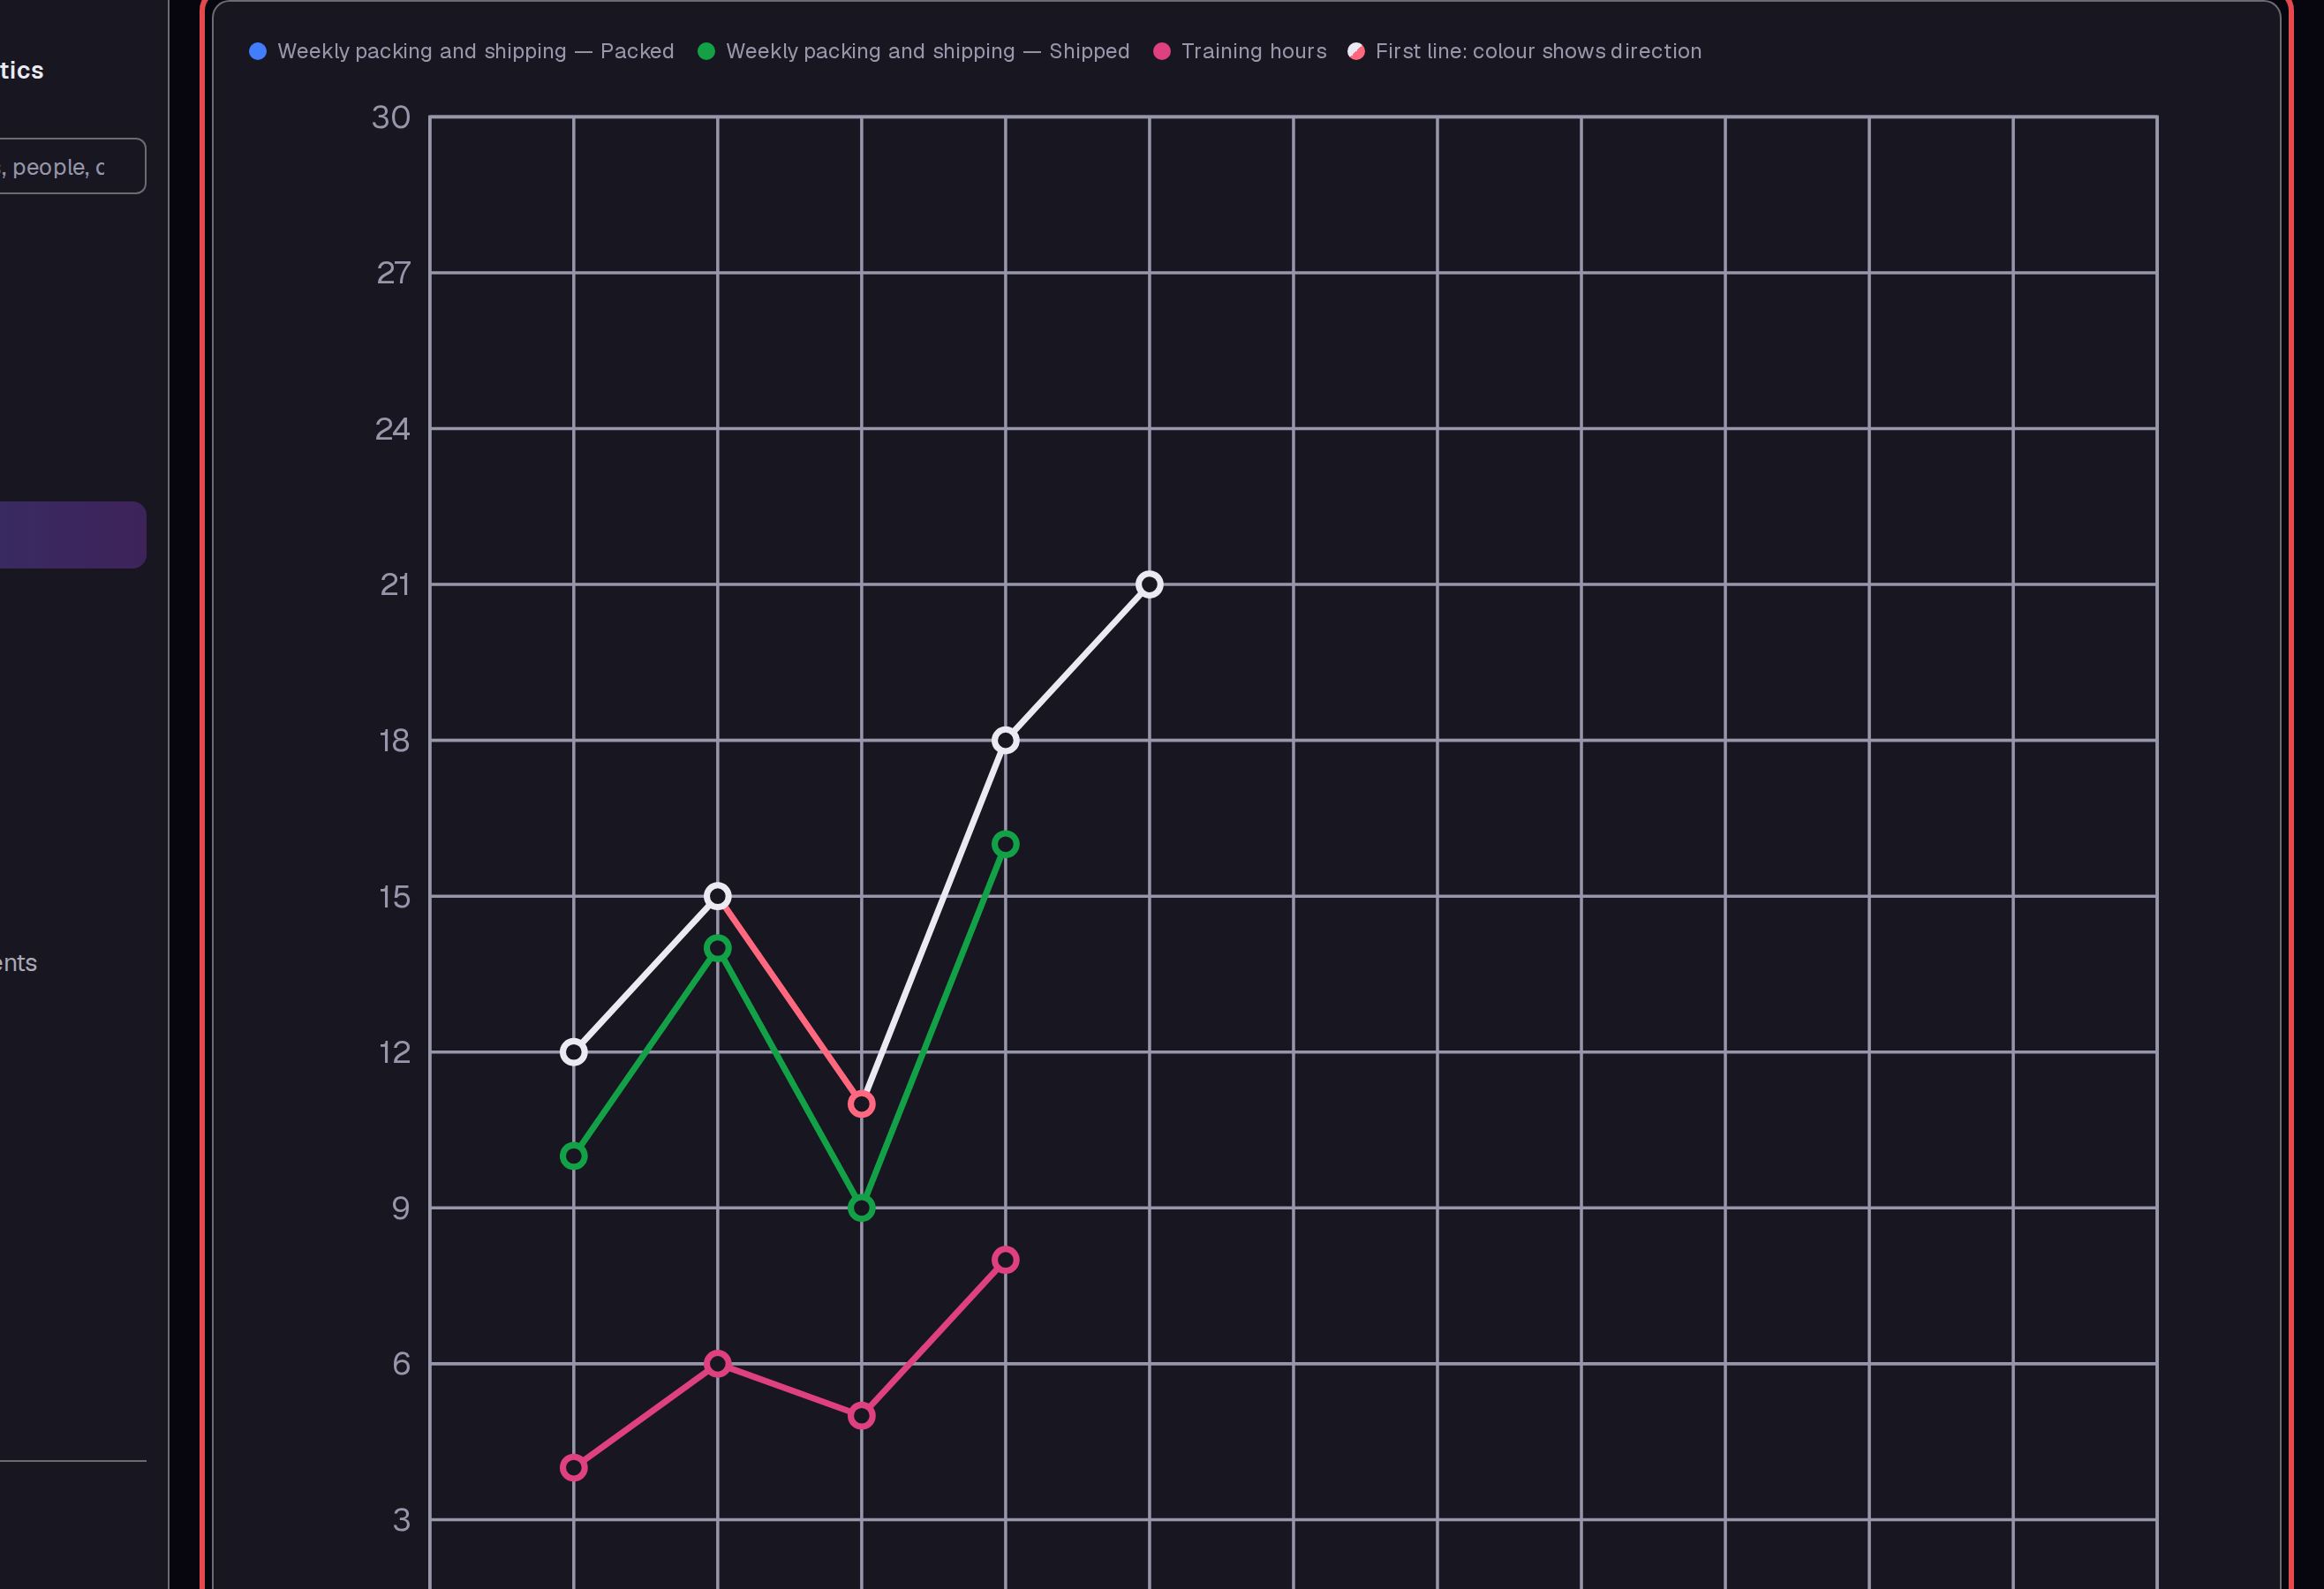
Open Packed and training. Use the labels above the graph to identify the Packed, Shipped, and Training hours lines.
Tips
- Period cannot be changed when a graph already has values. The edit form states this restriction.
- To correct a value, use Add value for the same line and date. In this example, 21 replaced 19.
- The Values table also shows Change and Running sum.
- The overview has shared date controls at the top and separate From and To controls under each graph.
What next
Read Track statistics for the basic graph workflow. Use Run a project to assign work that follows from your review.