How to draw and export a flowchart
about 8 minutes
A flowchart shows the order of actions in a process. Use it to explain work to your team before they start.
Step 1 — Create a flowchart
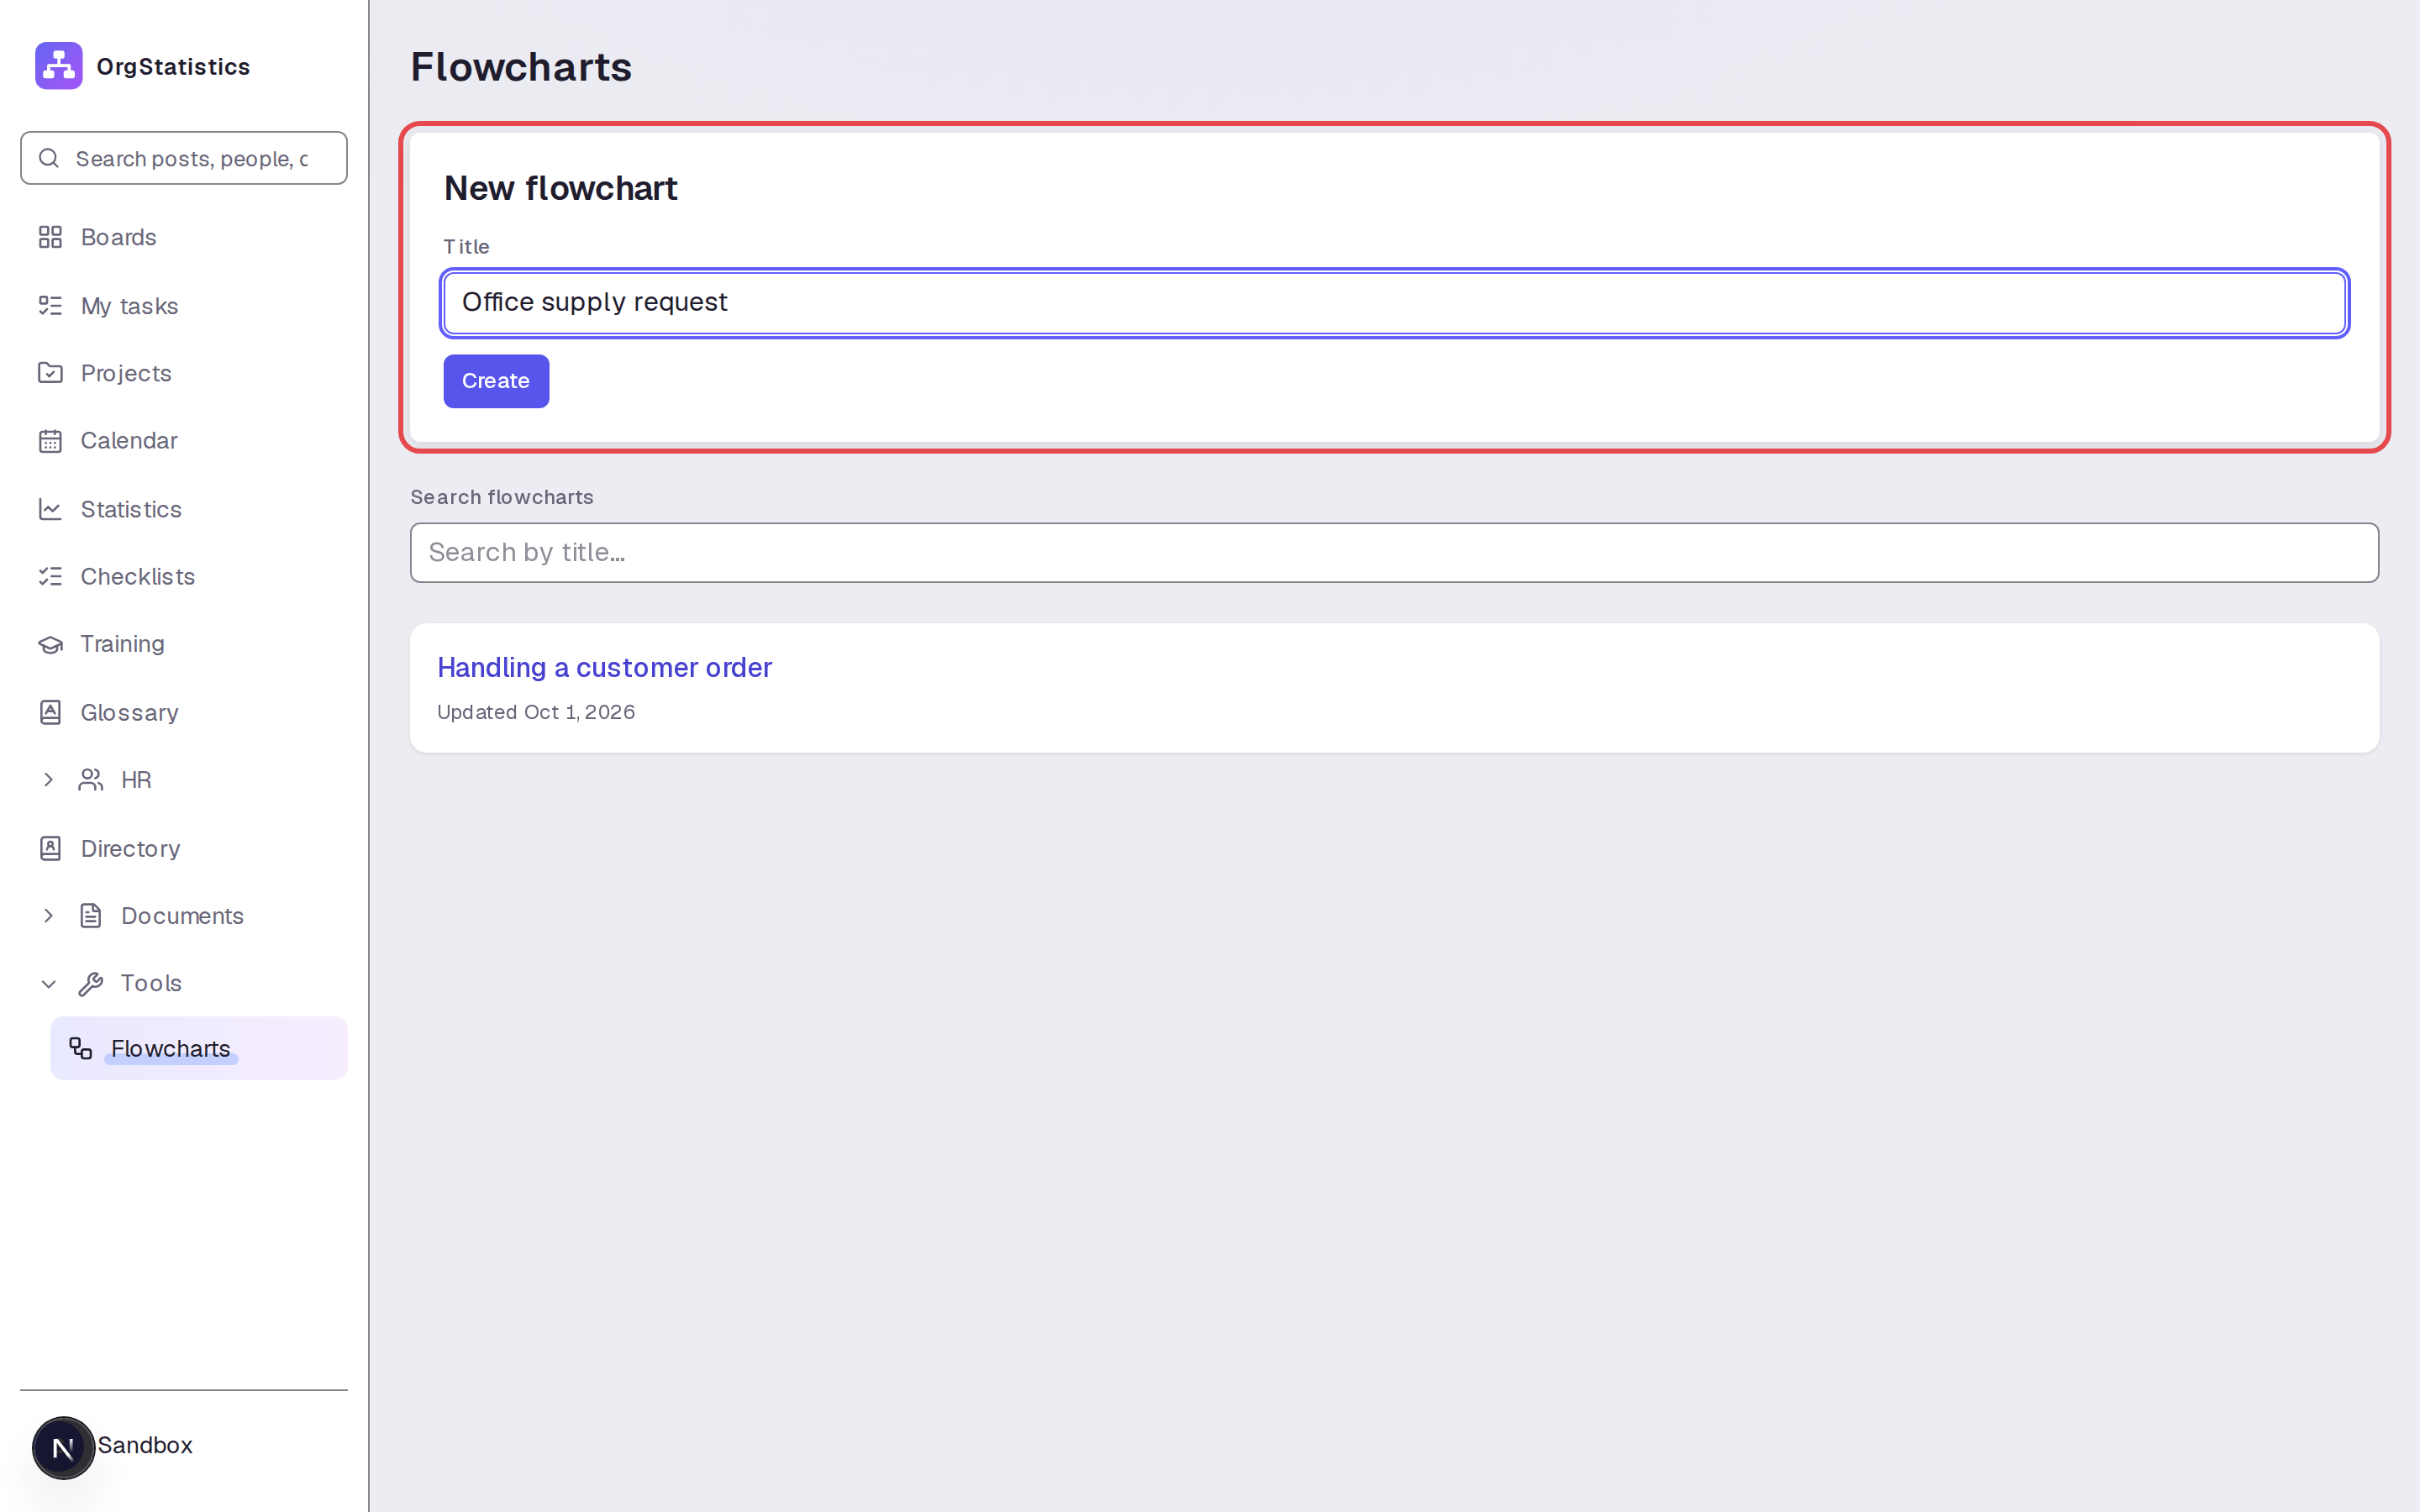
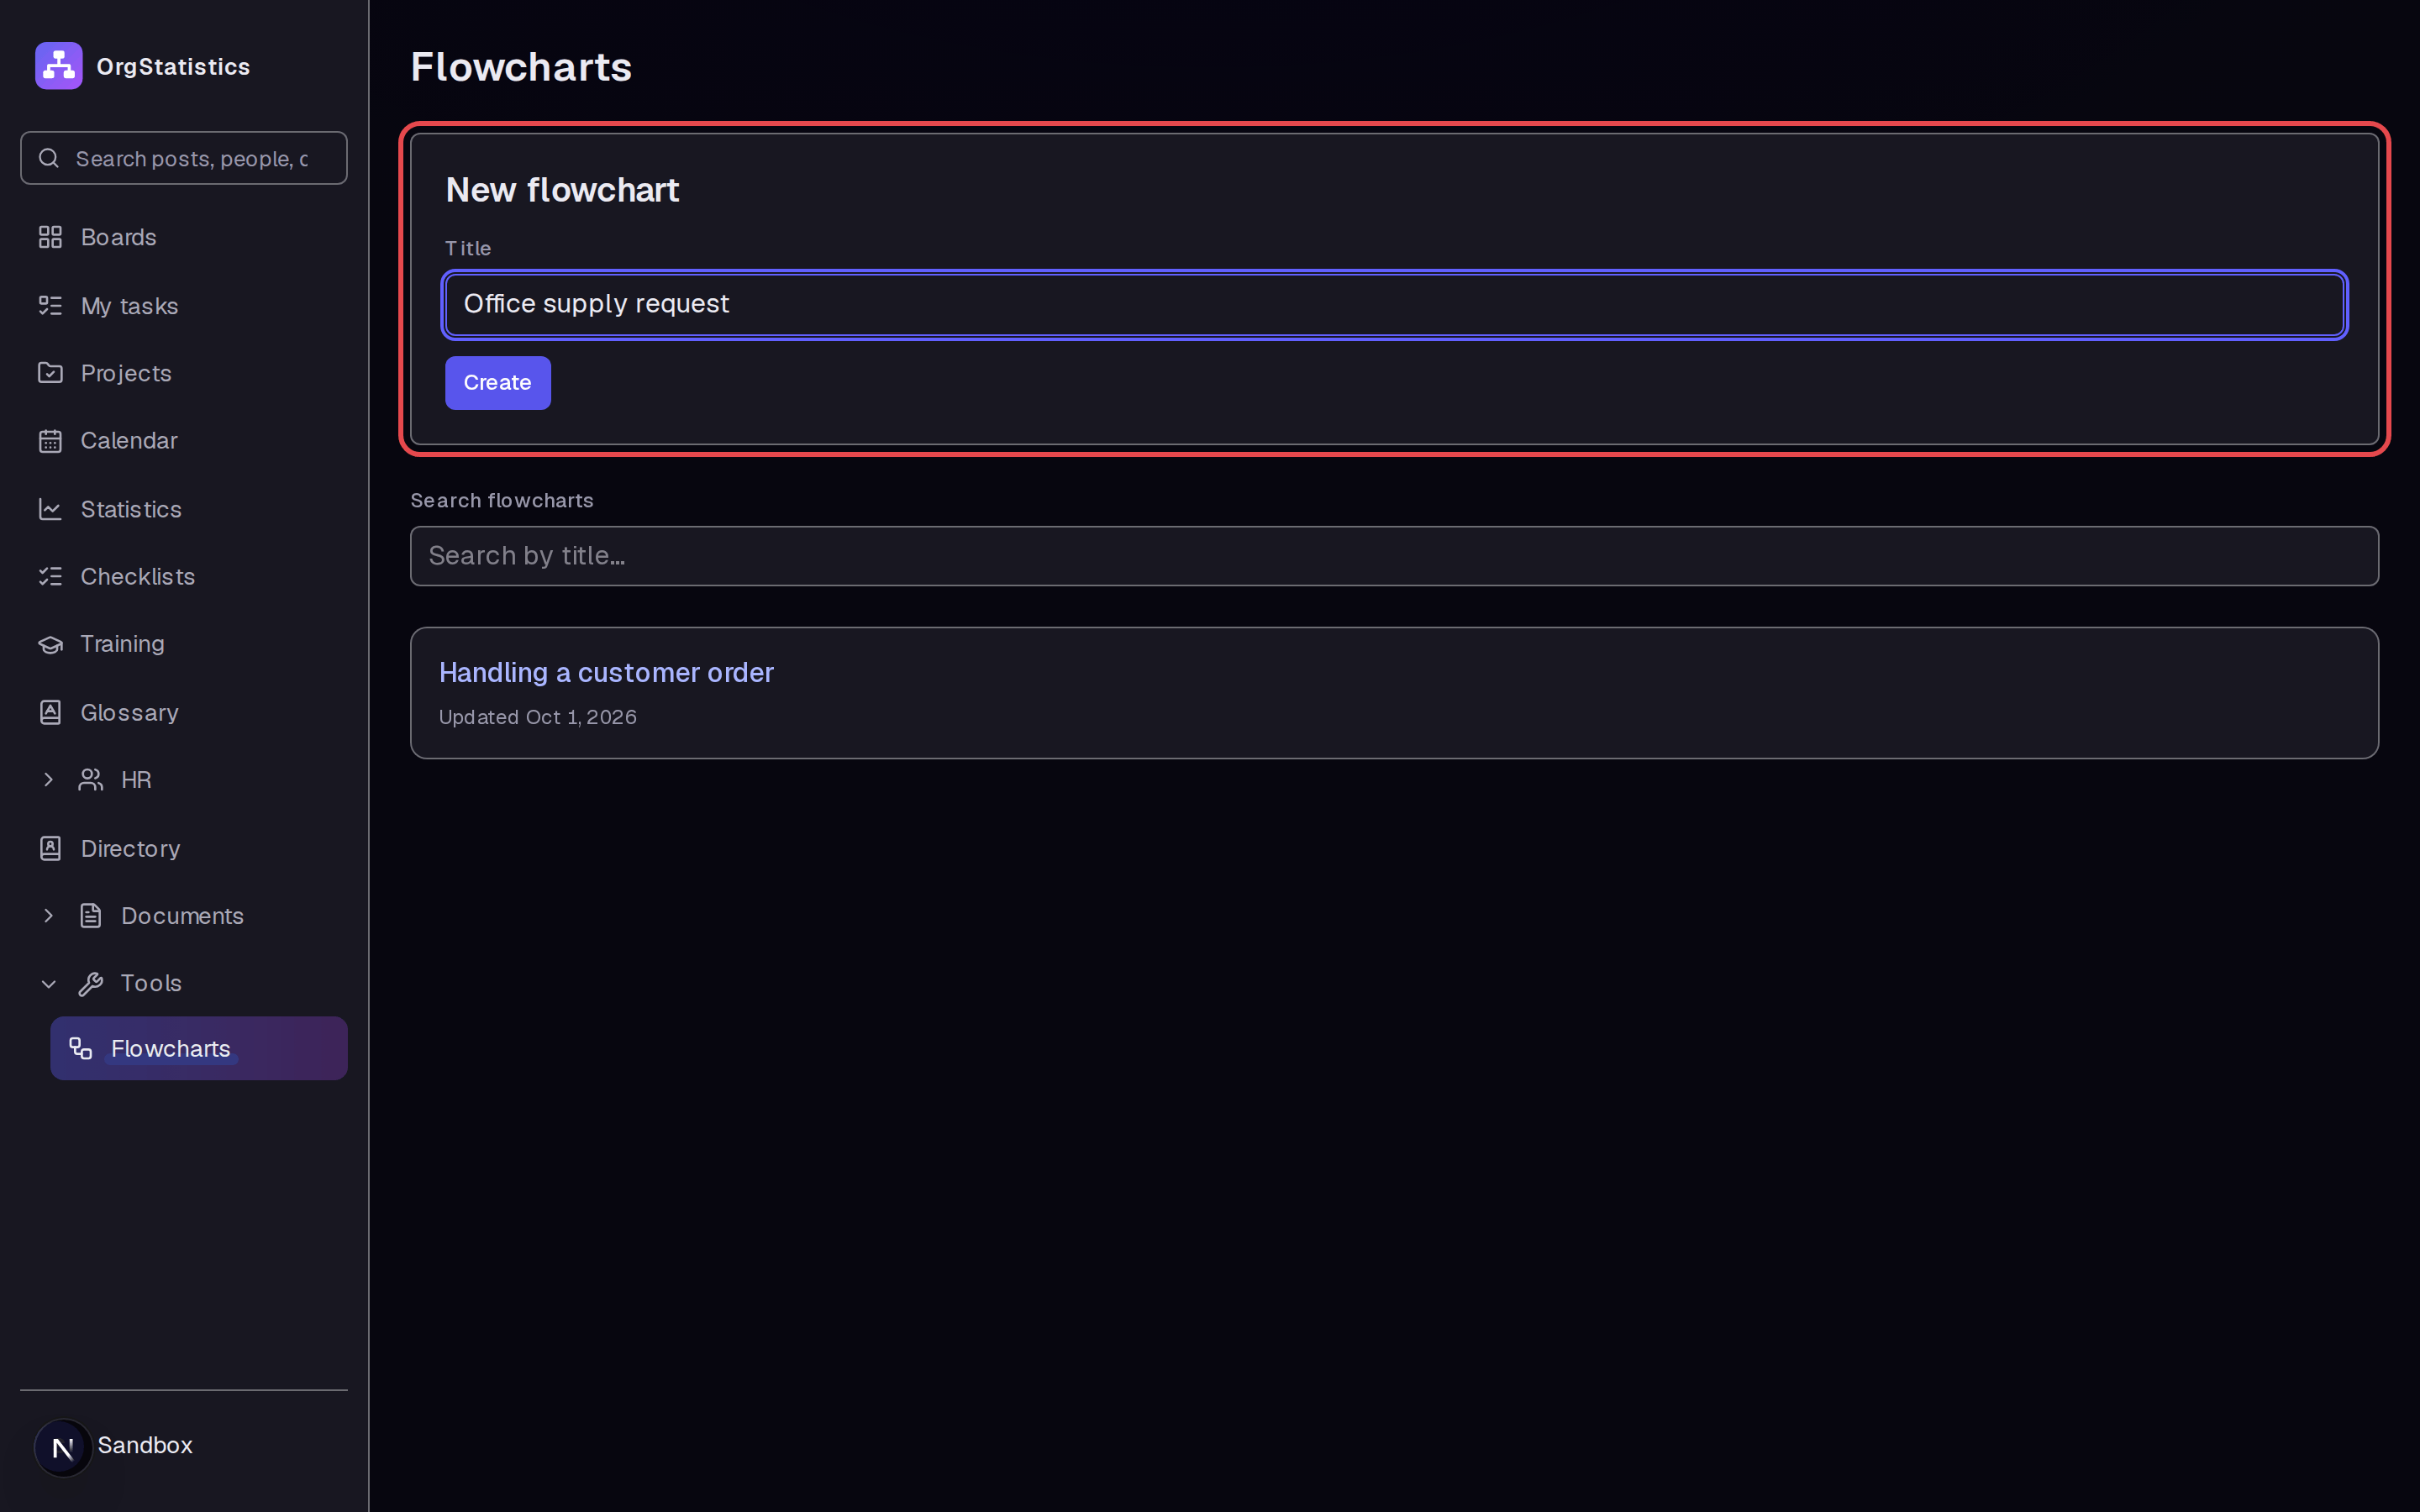
Open Flowcharts under Tools in the left menu. Enter “Office supply request” in Title. Click Create to open the editor.
Step 2 — Add the start shape
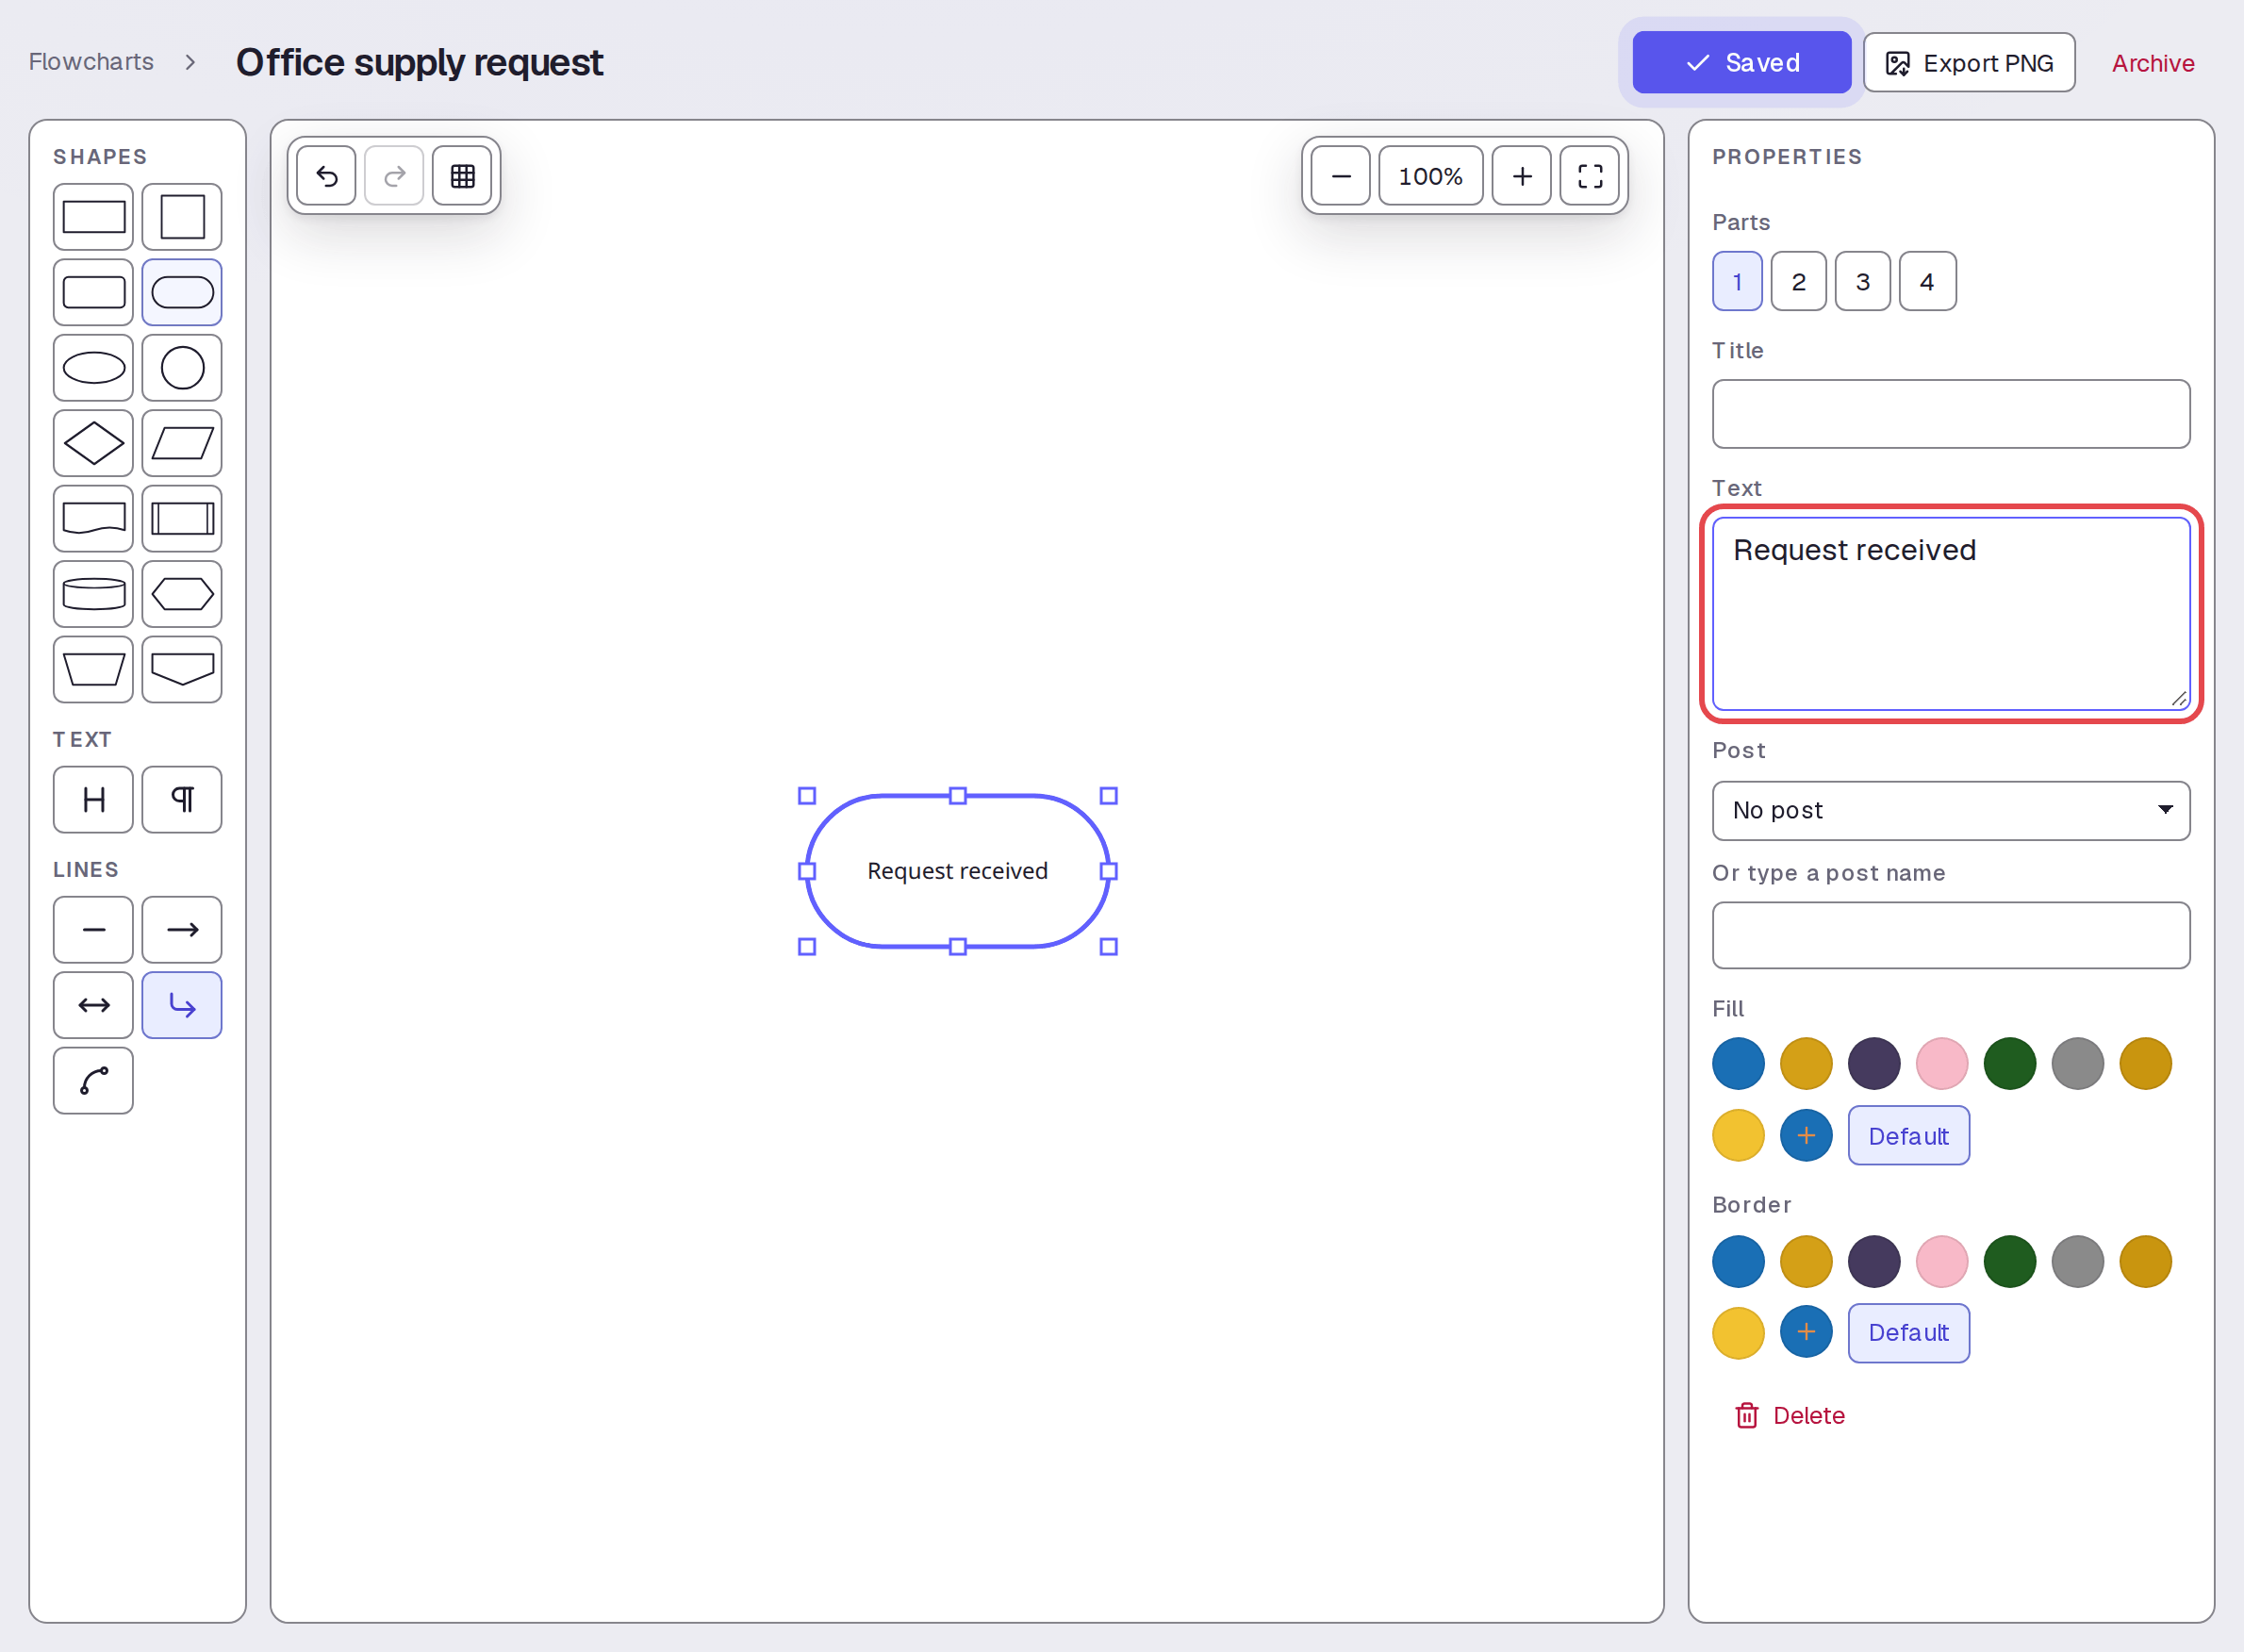
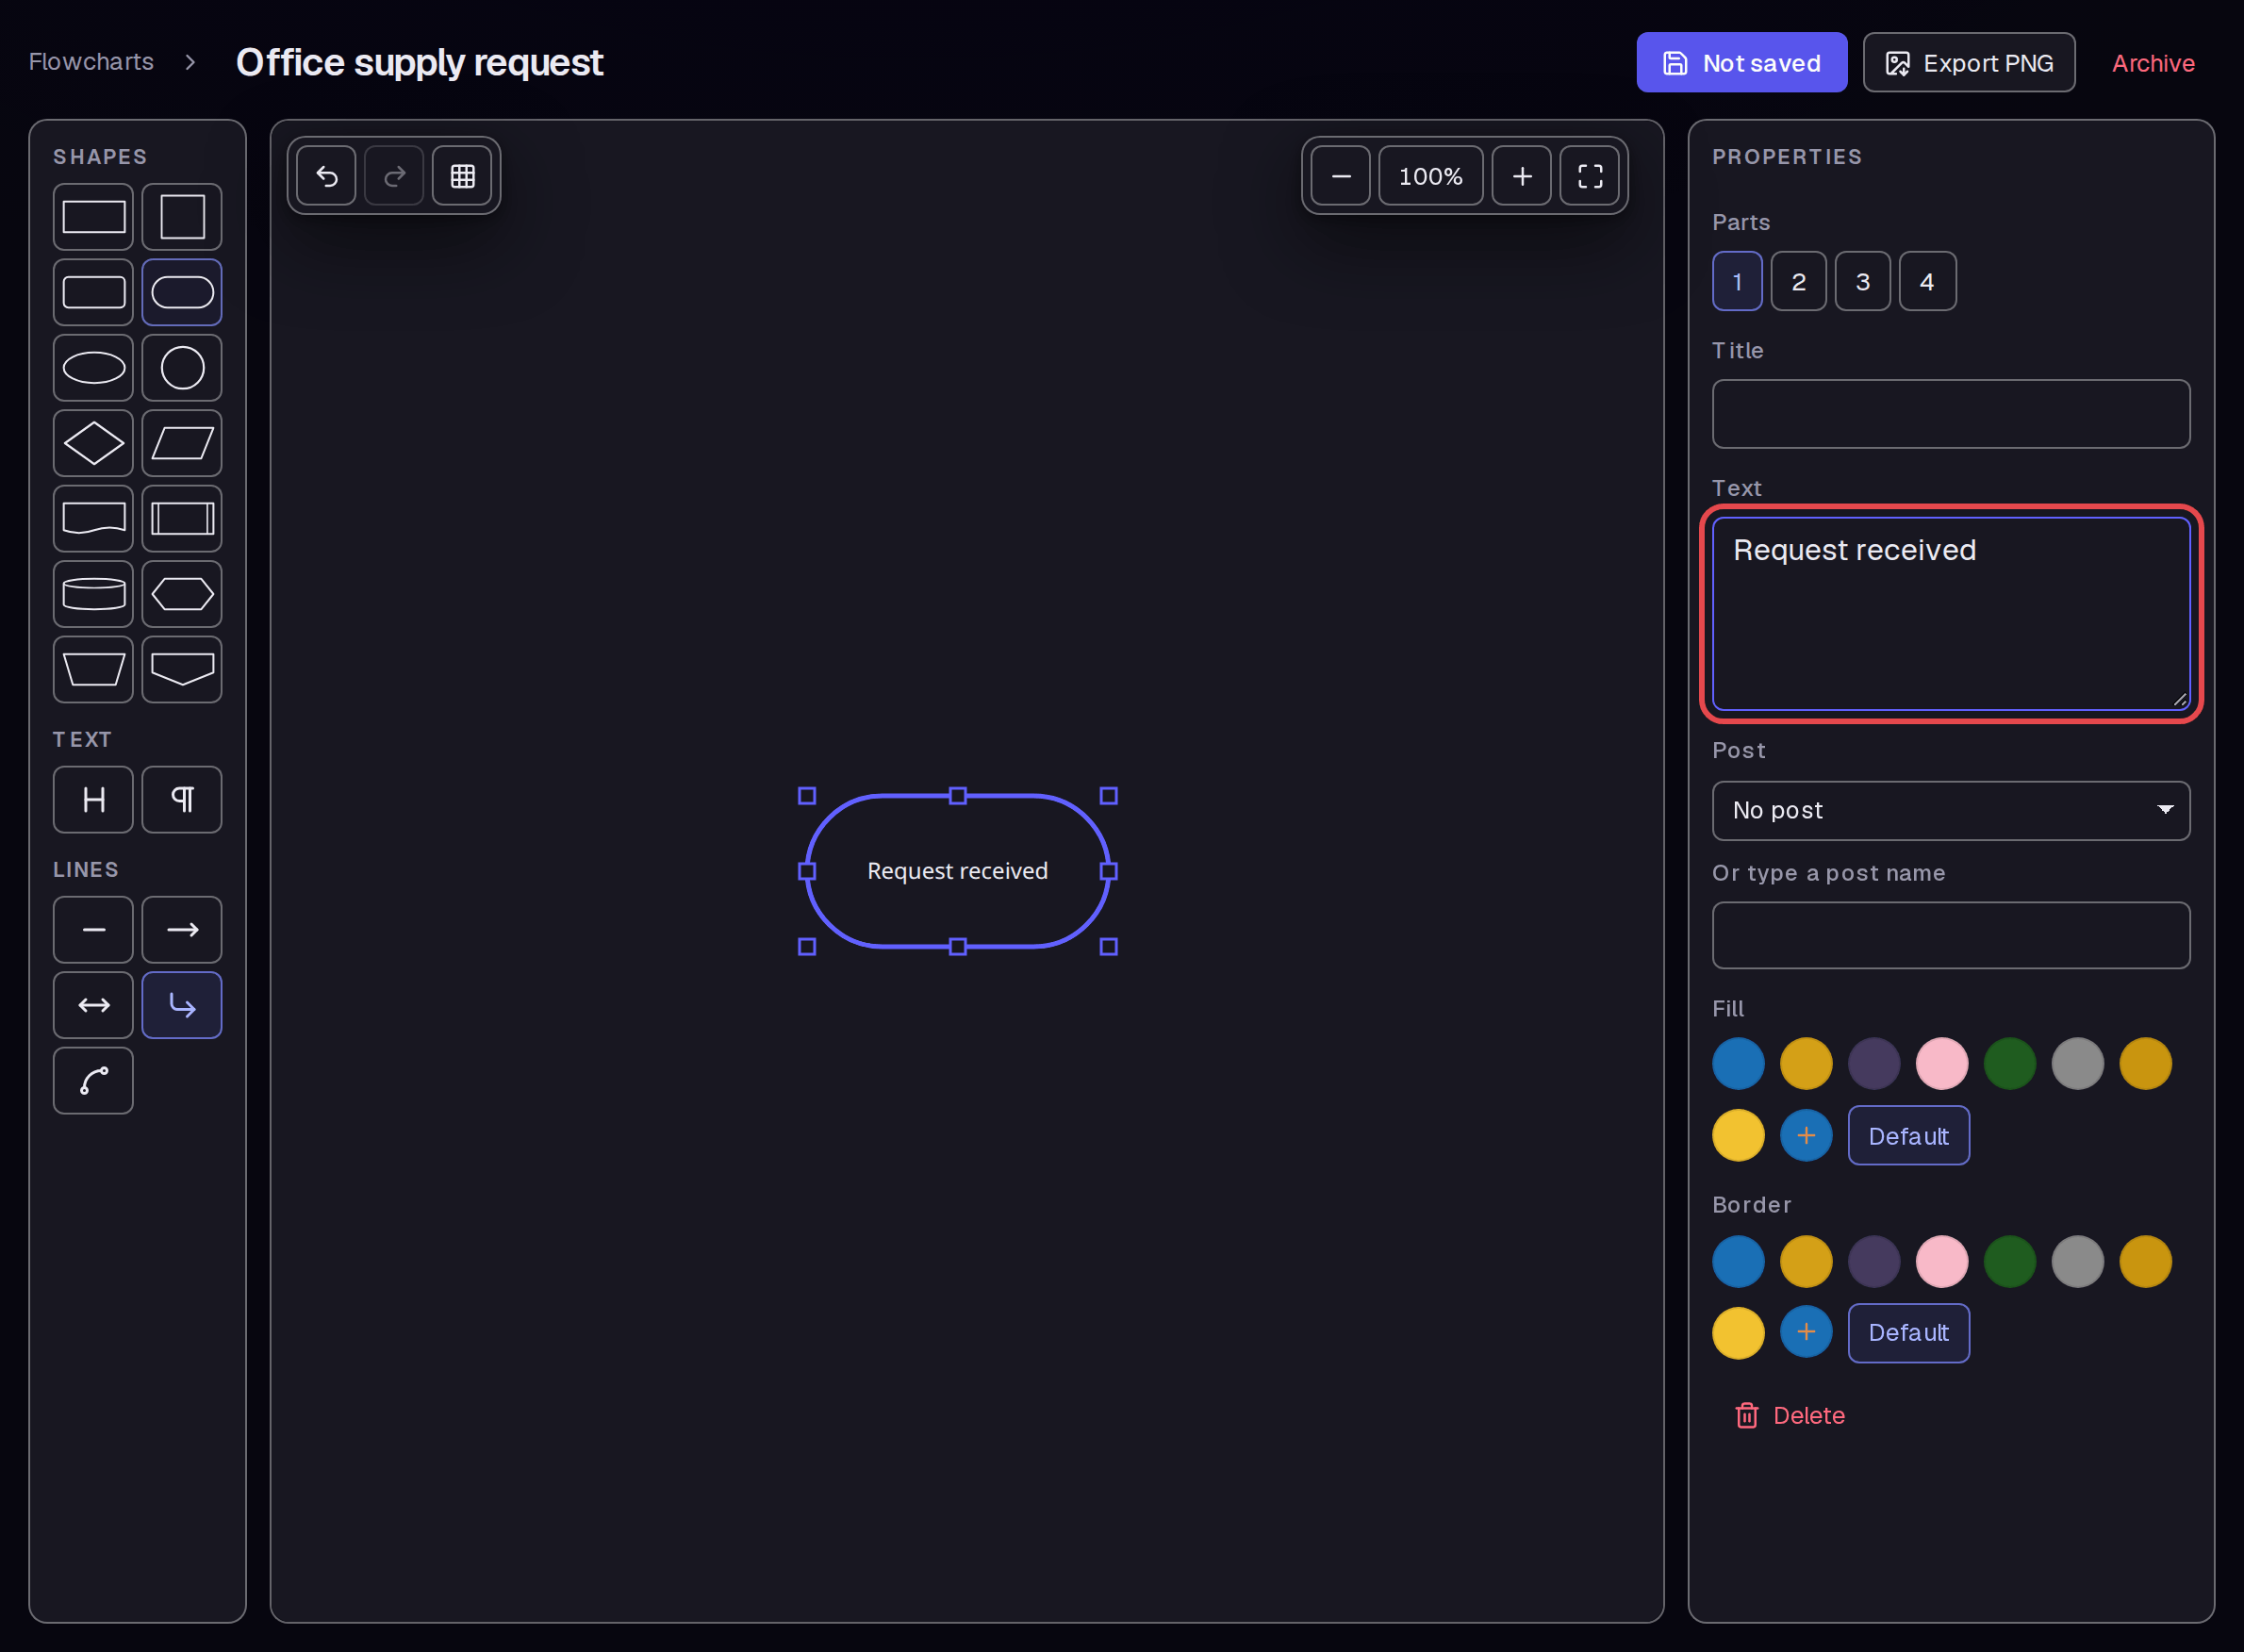
Click Start / End under SHAPES on the left. In PROPERTIES on the right, enter “Request received” in Text.
Step 3 — Add the process shape
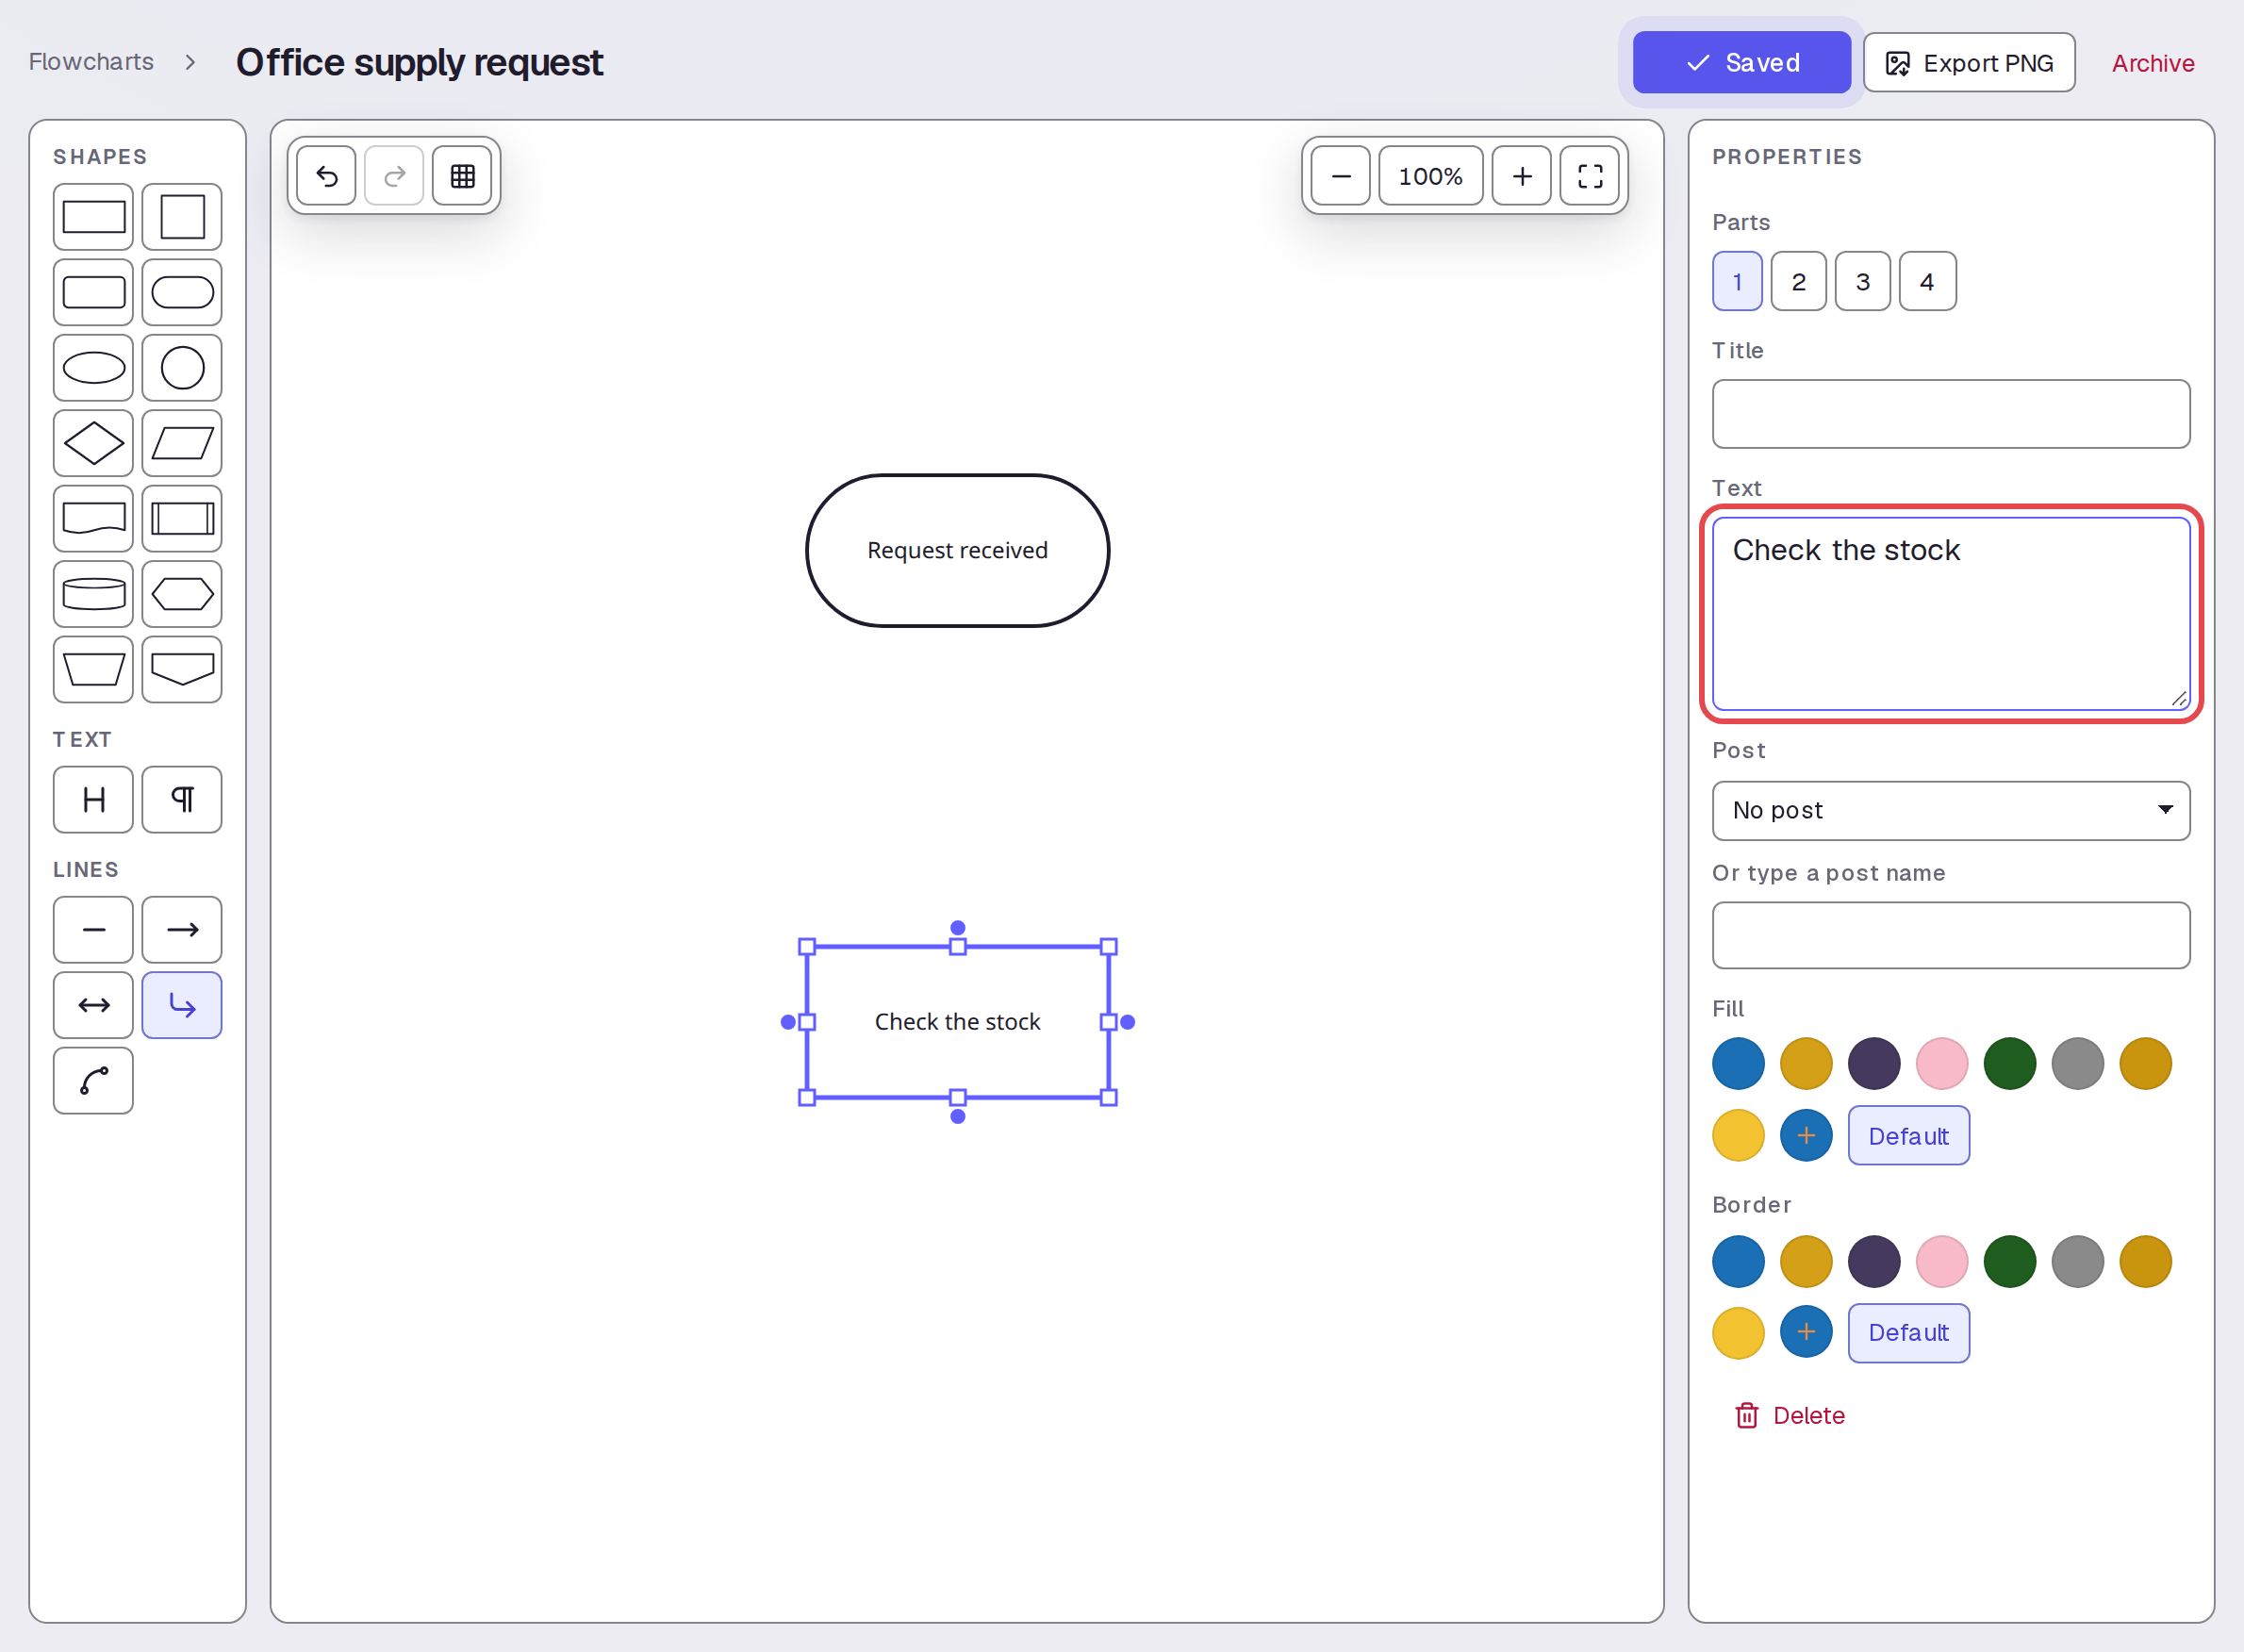
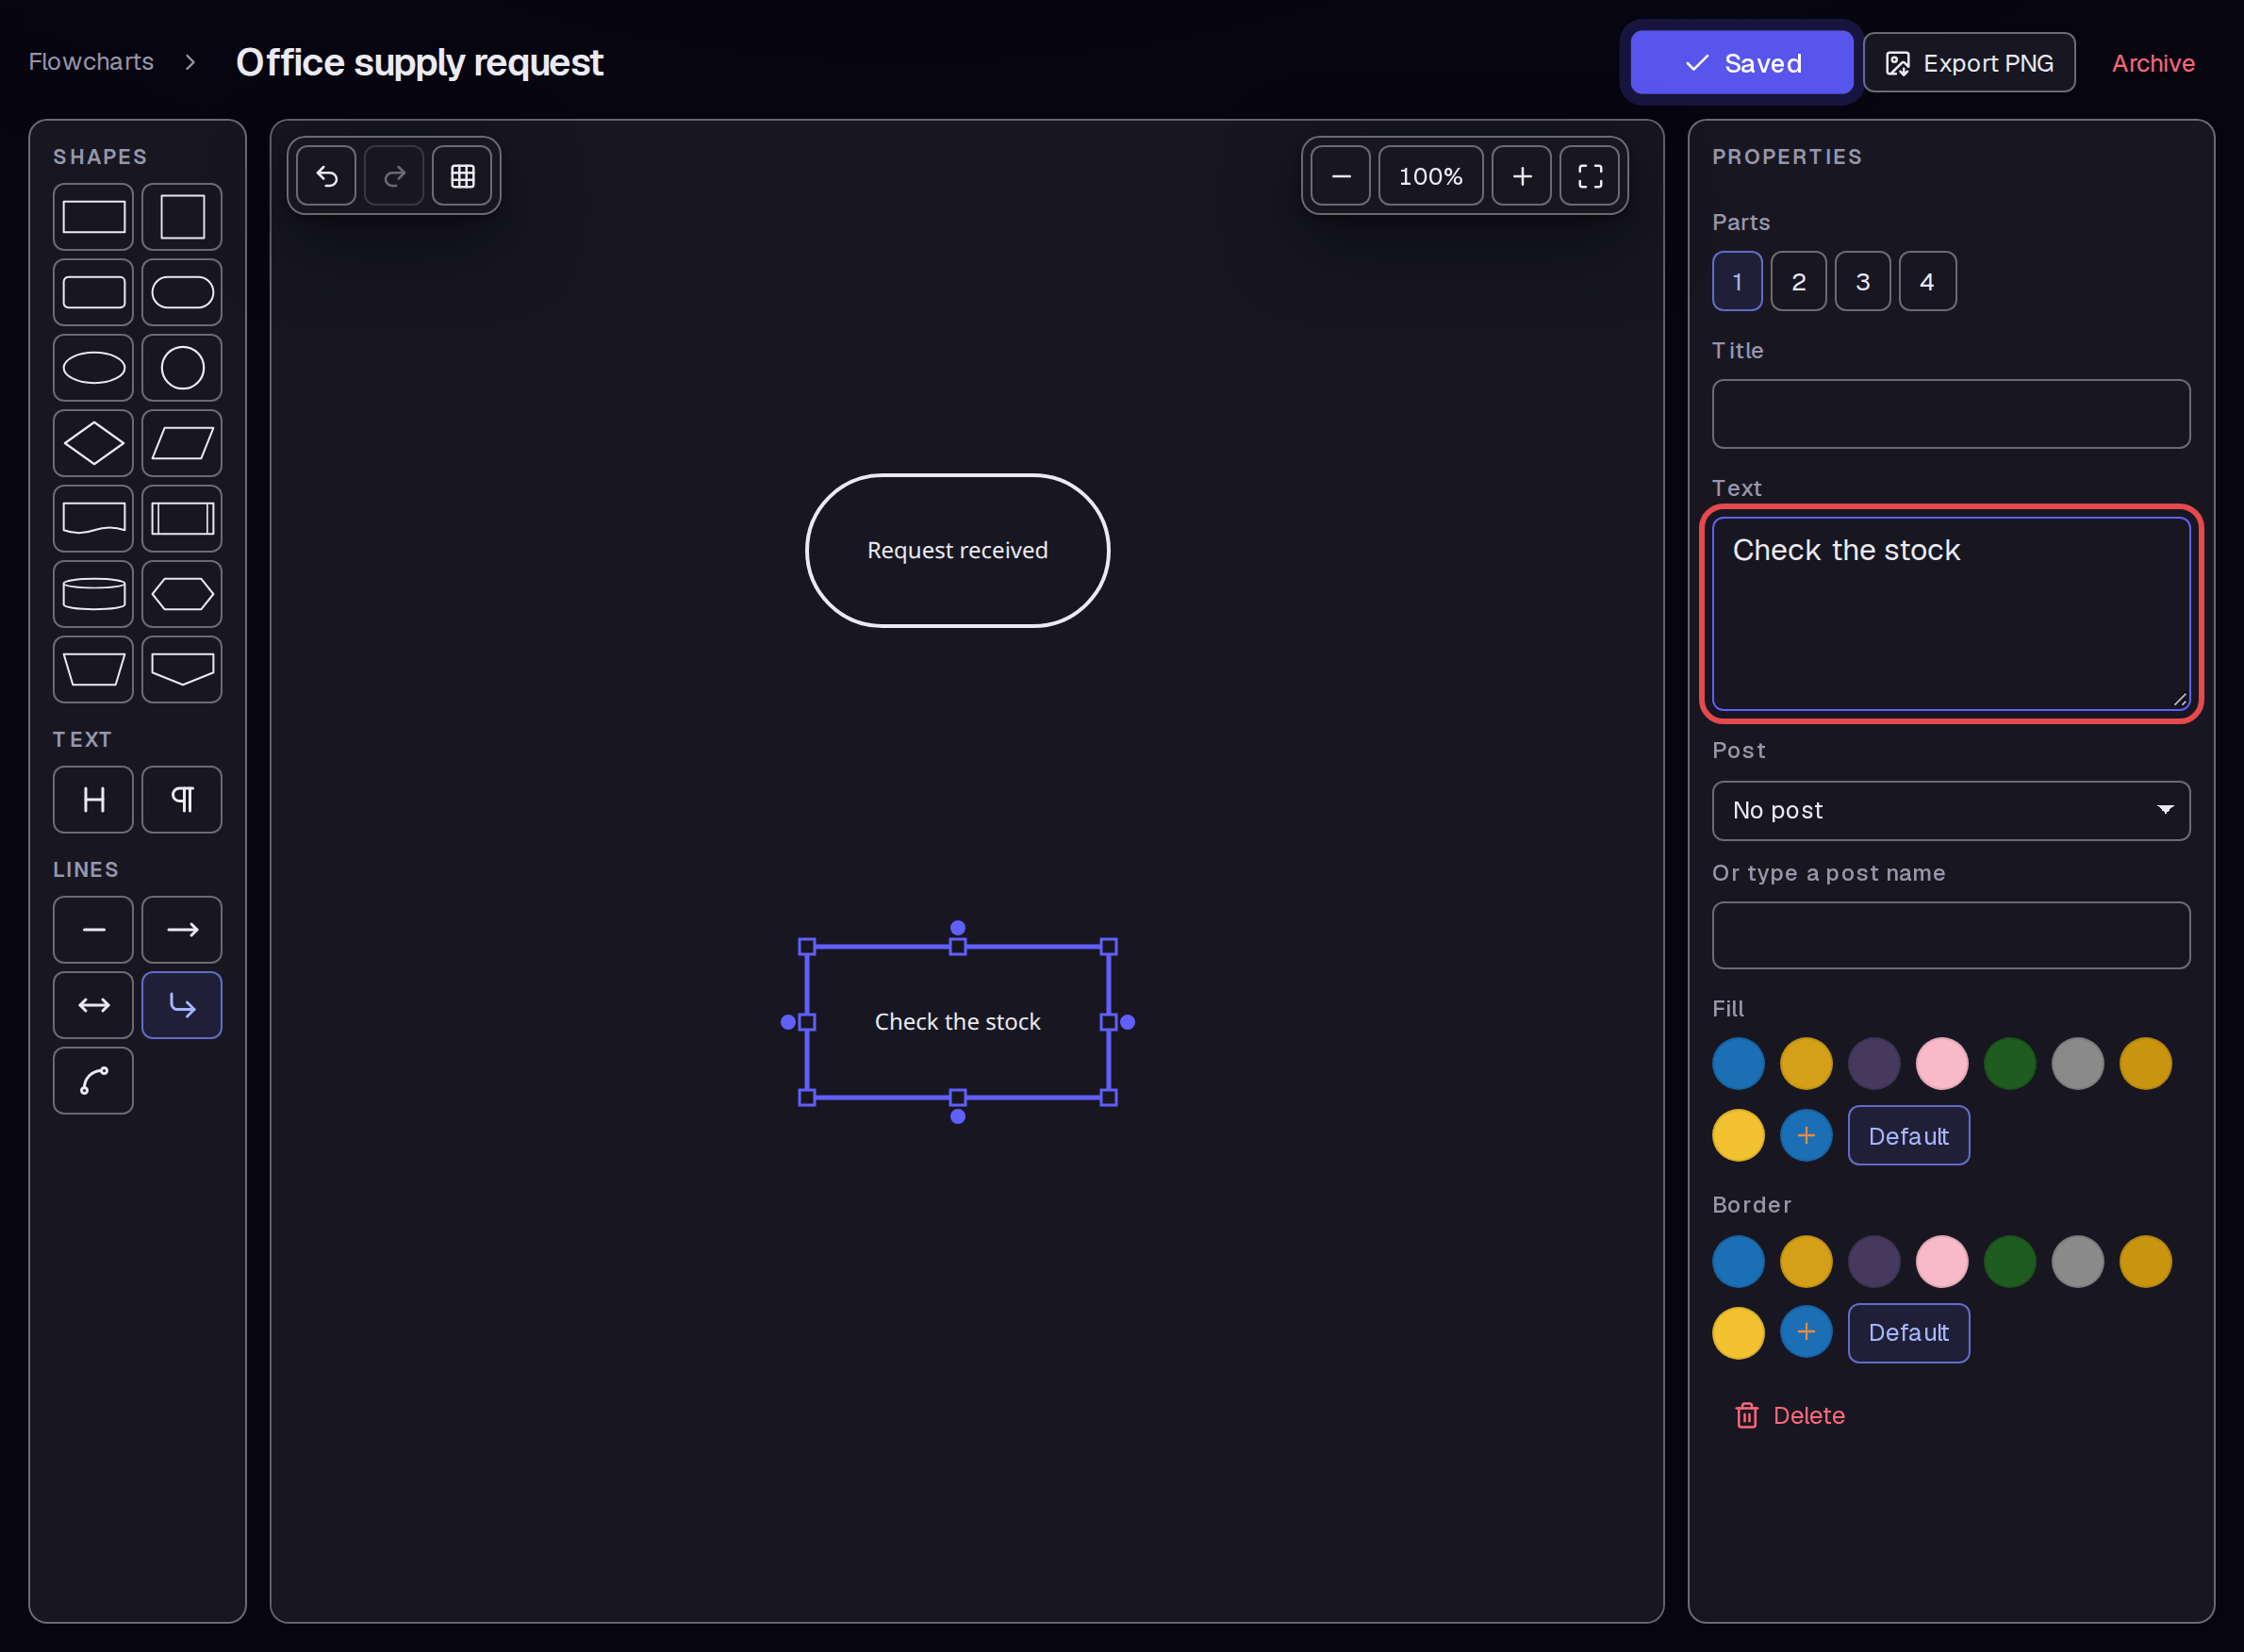
Add a Process shape with the button on the left. Enter “Check the stock” in Text. Arrange the shapes as shown by dragging them on the canvas.
Step 4 — Connect the shapes
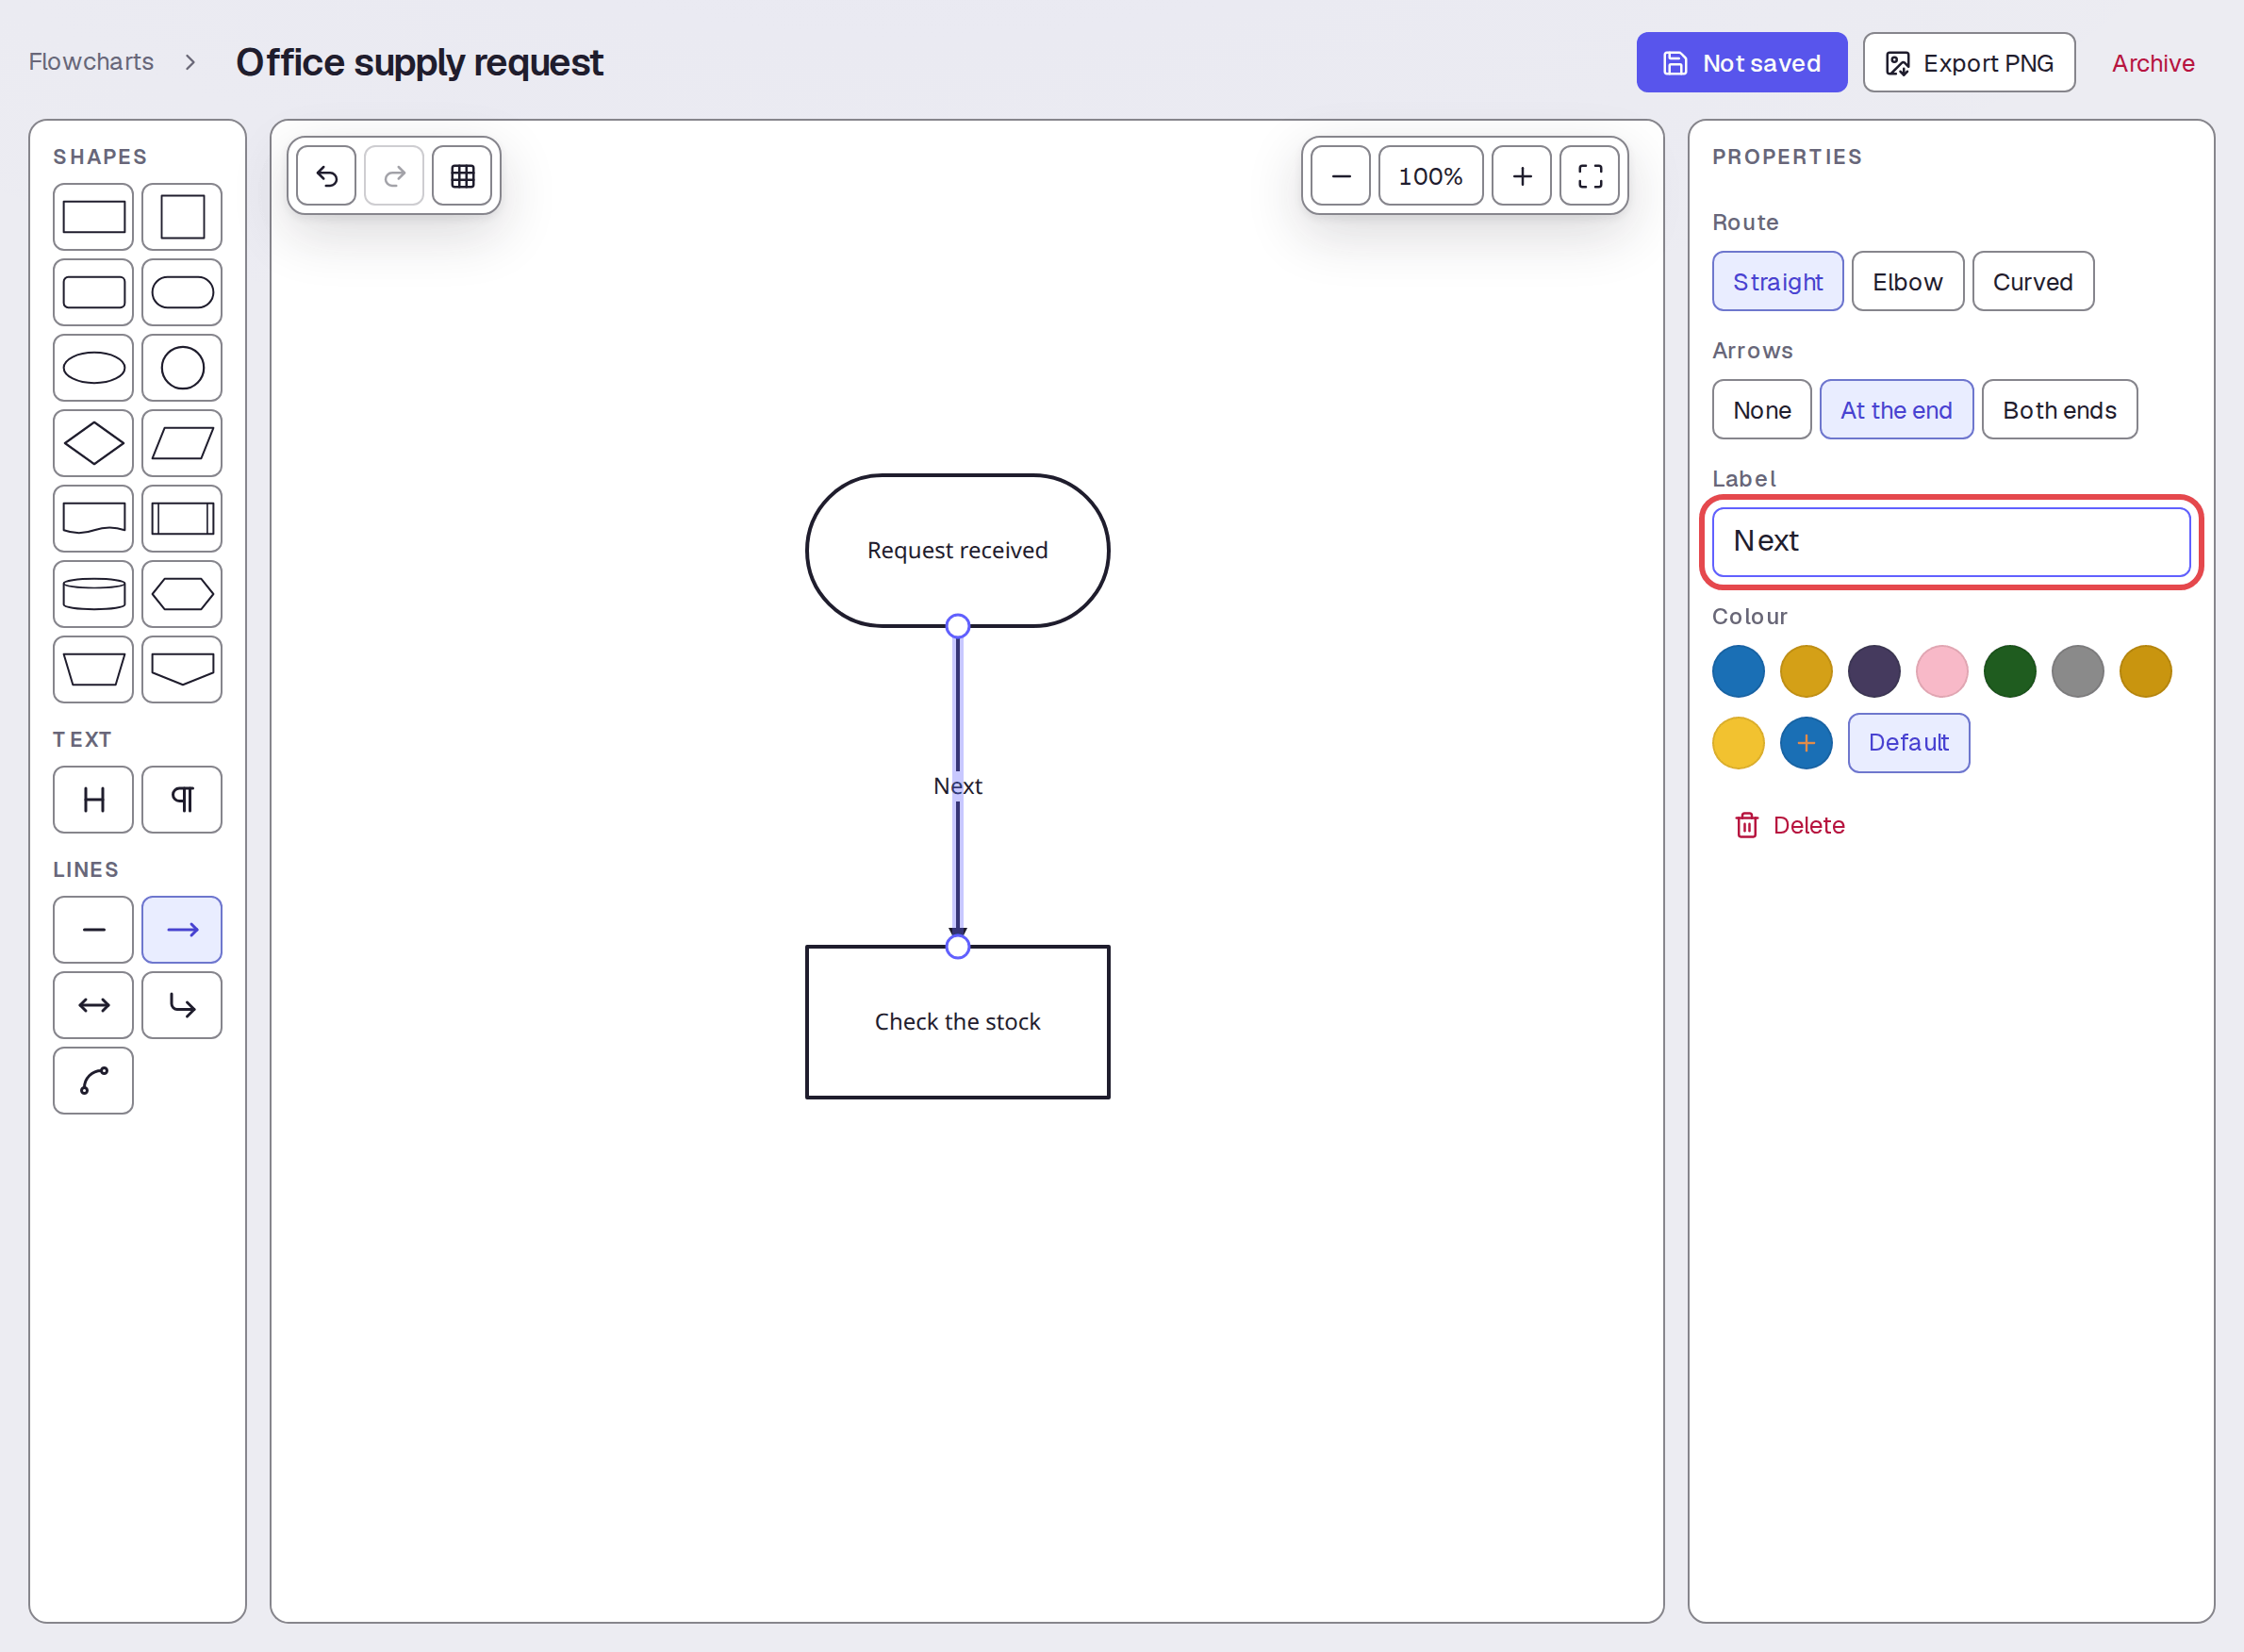
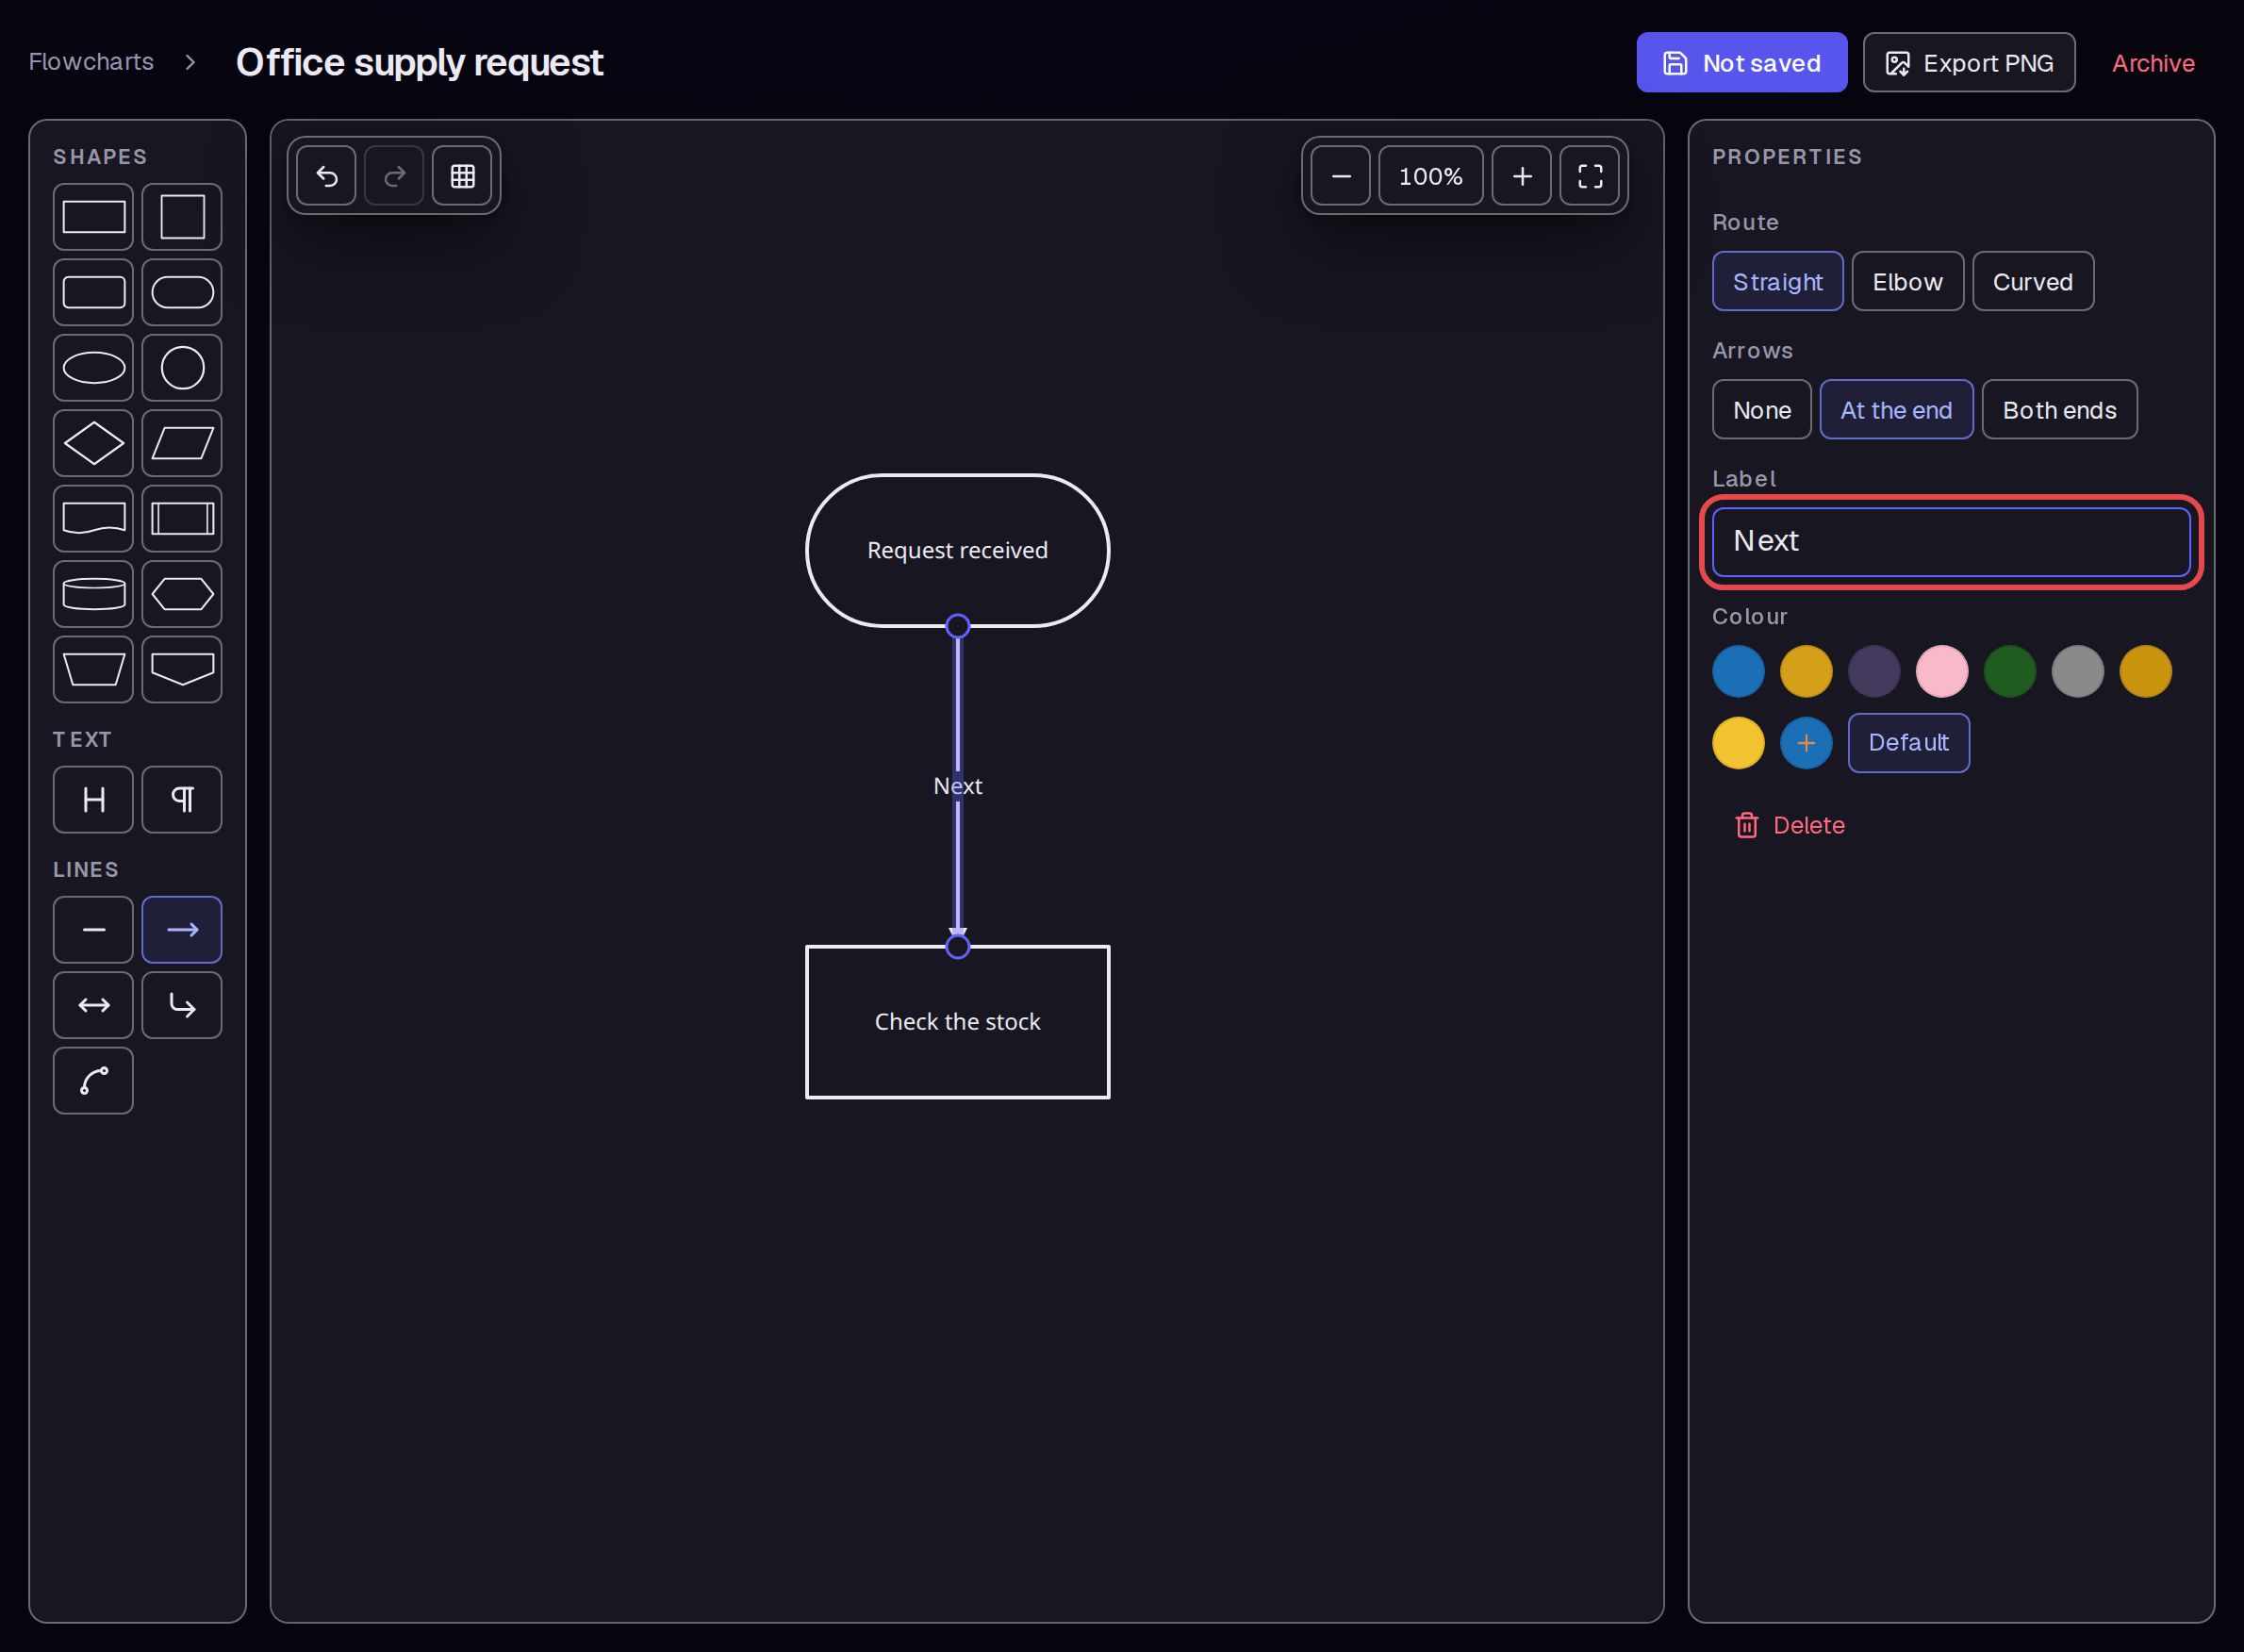
Click Arrow under LINES. Position its round ends at the bottom of the start shape and the top of the process shape by dragging each end. Enter “Next” in Label.
Step 5 — Add a heading
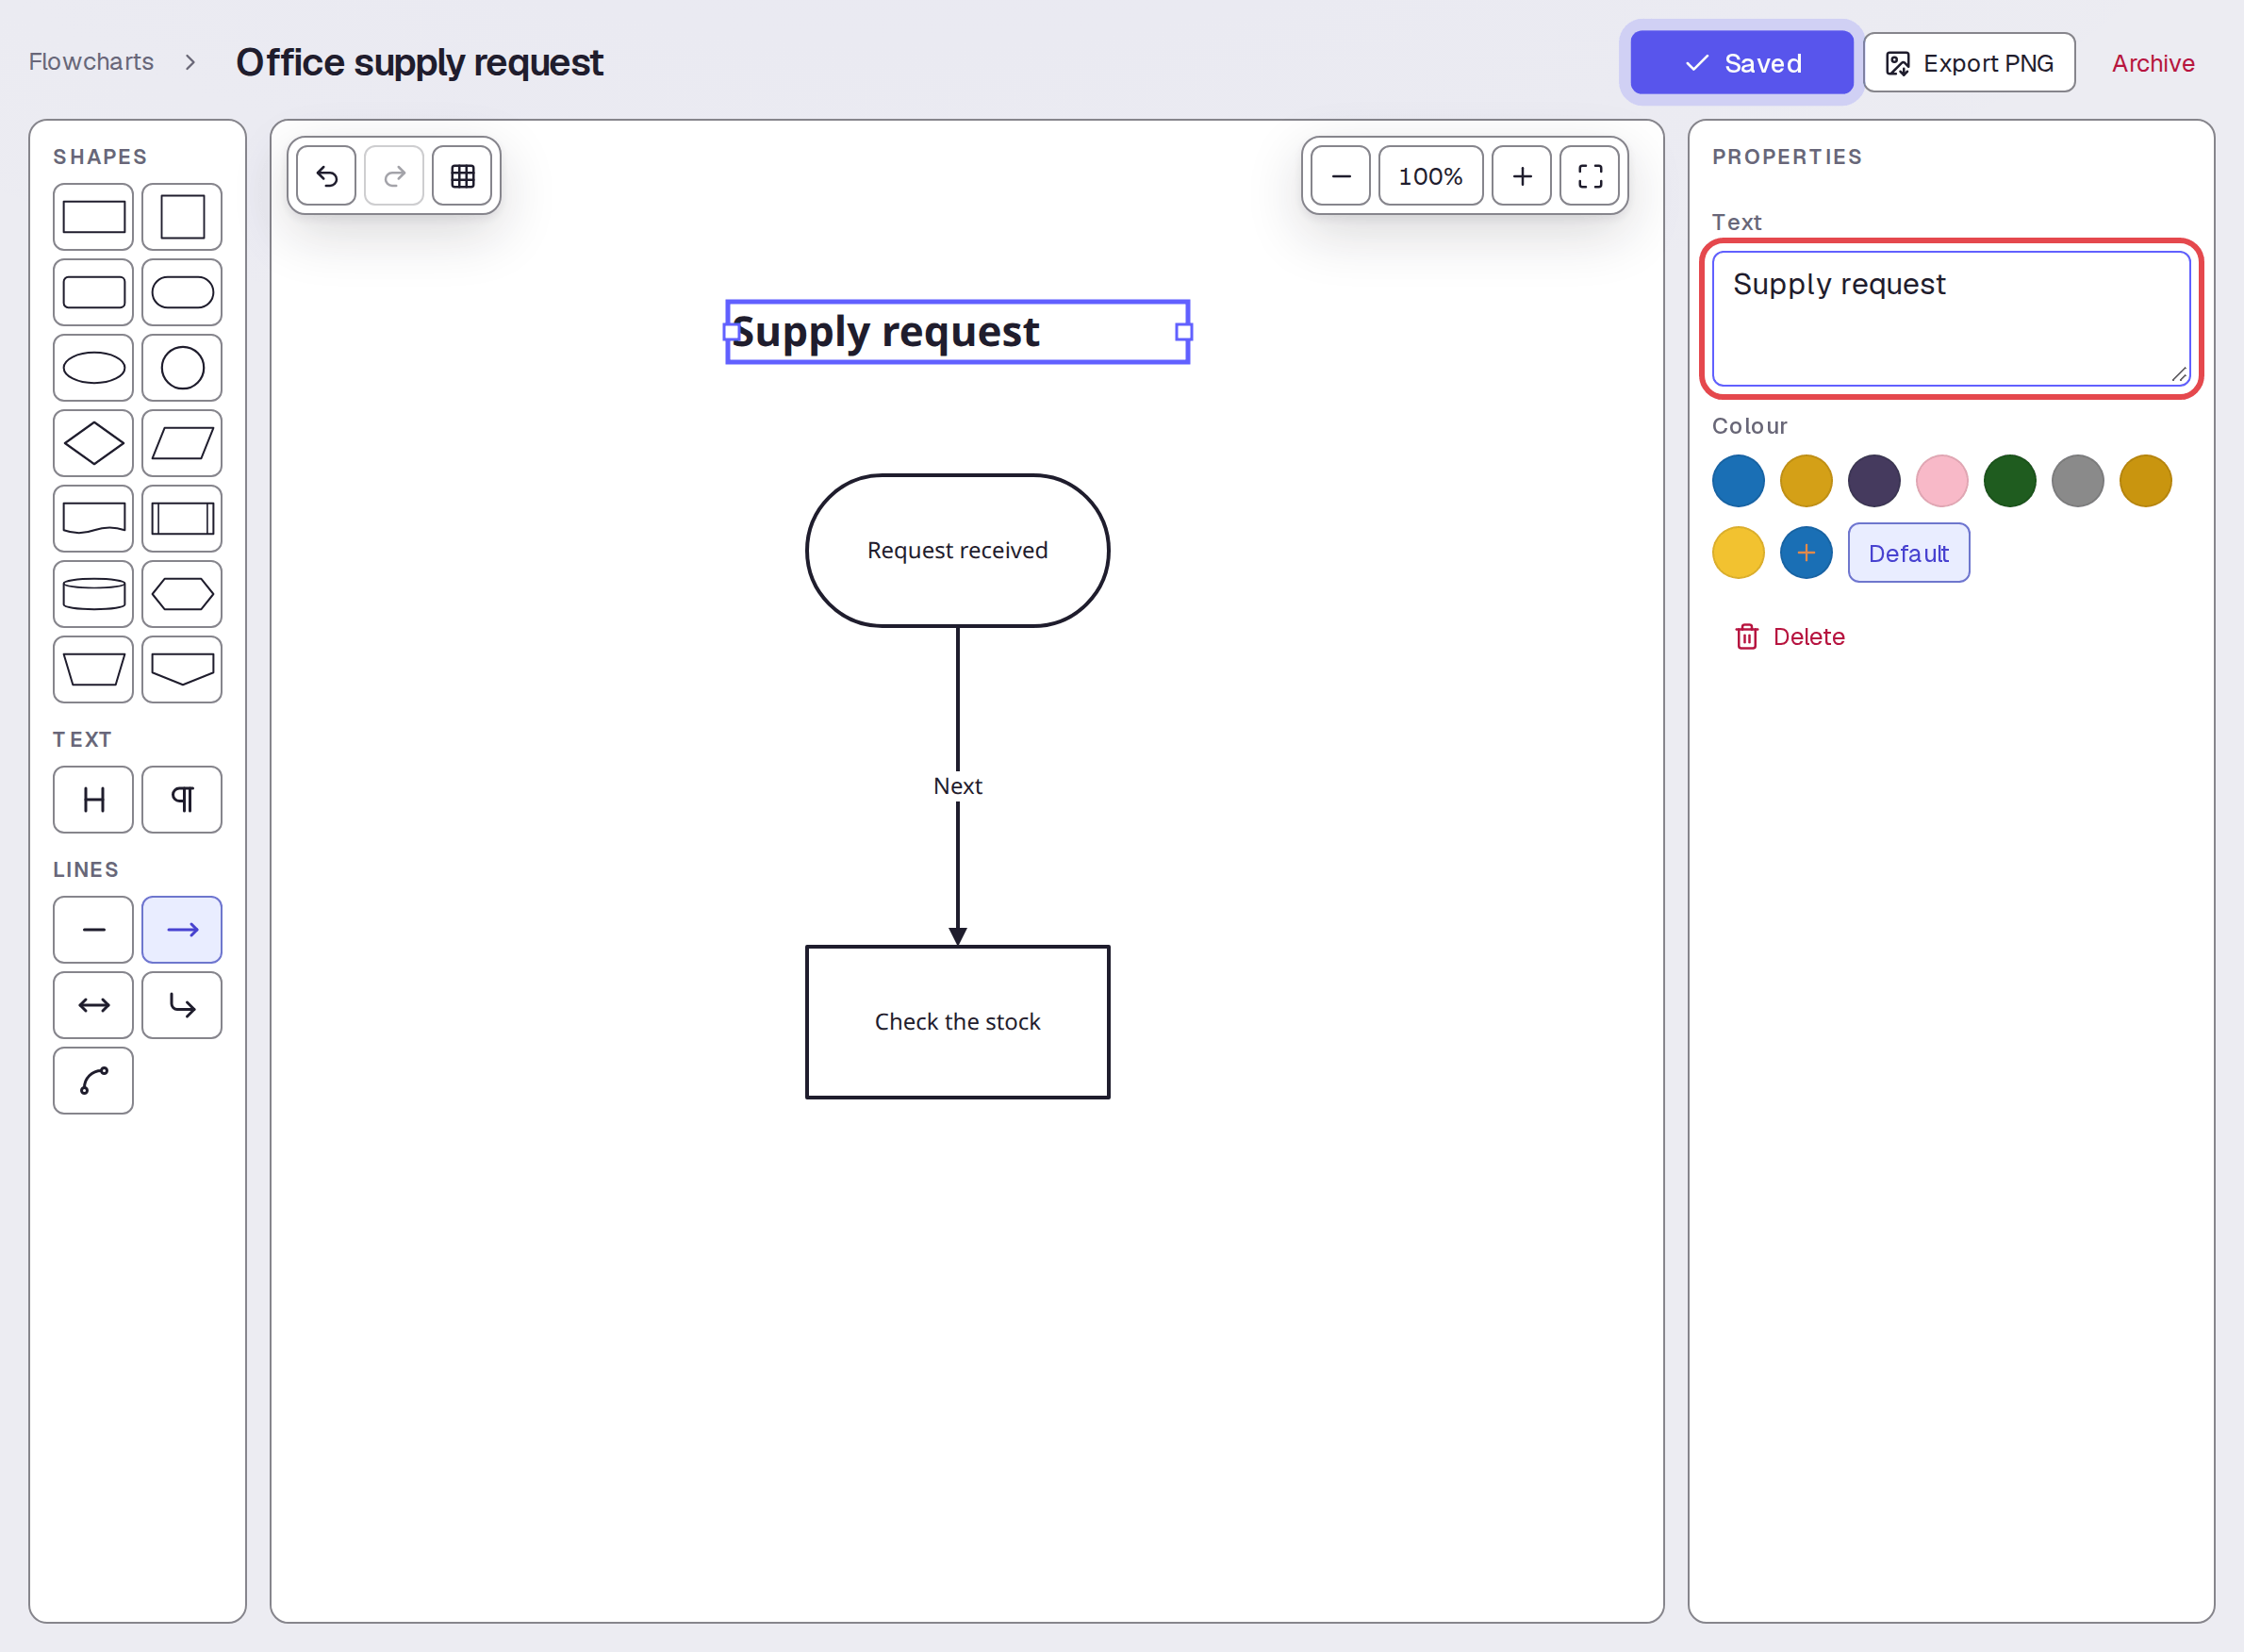
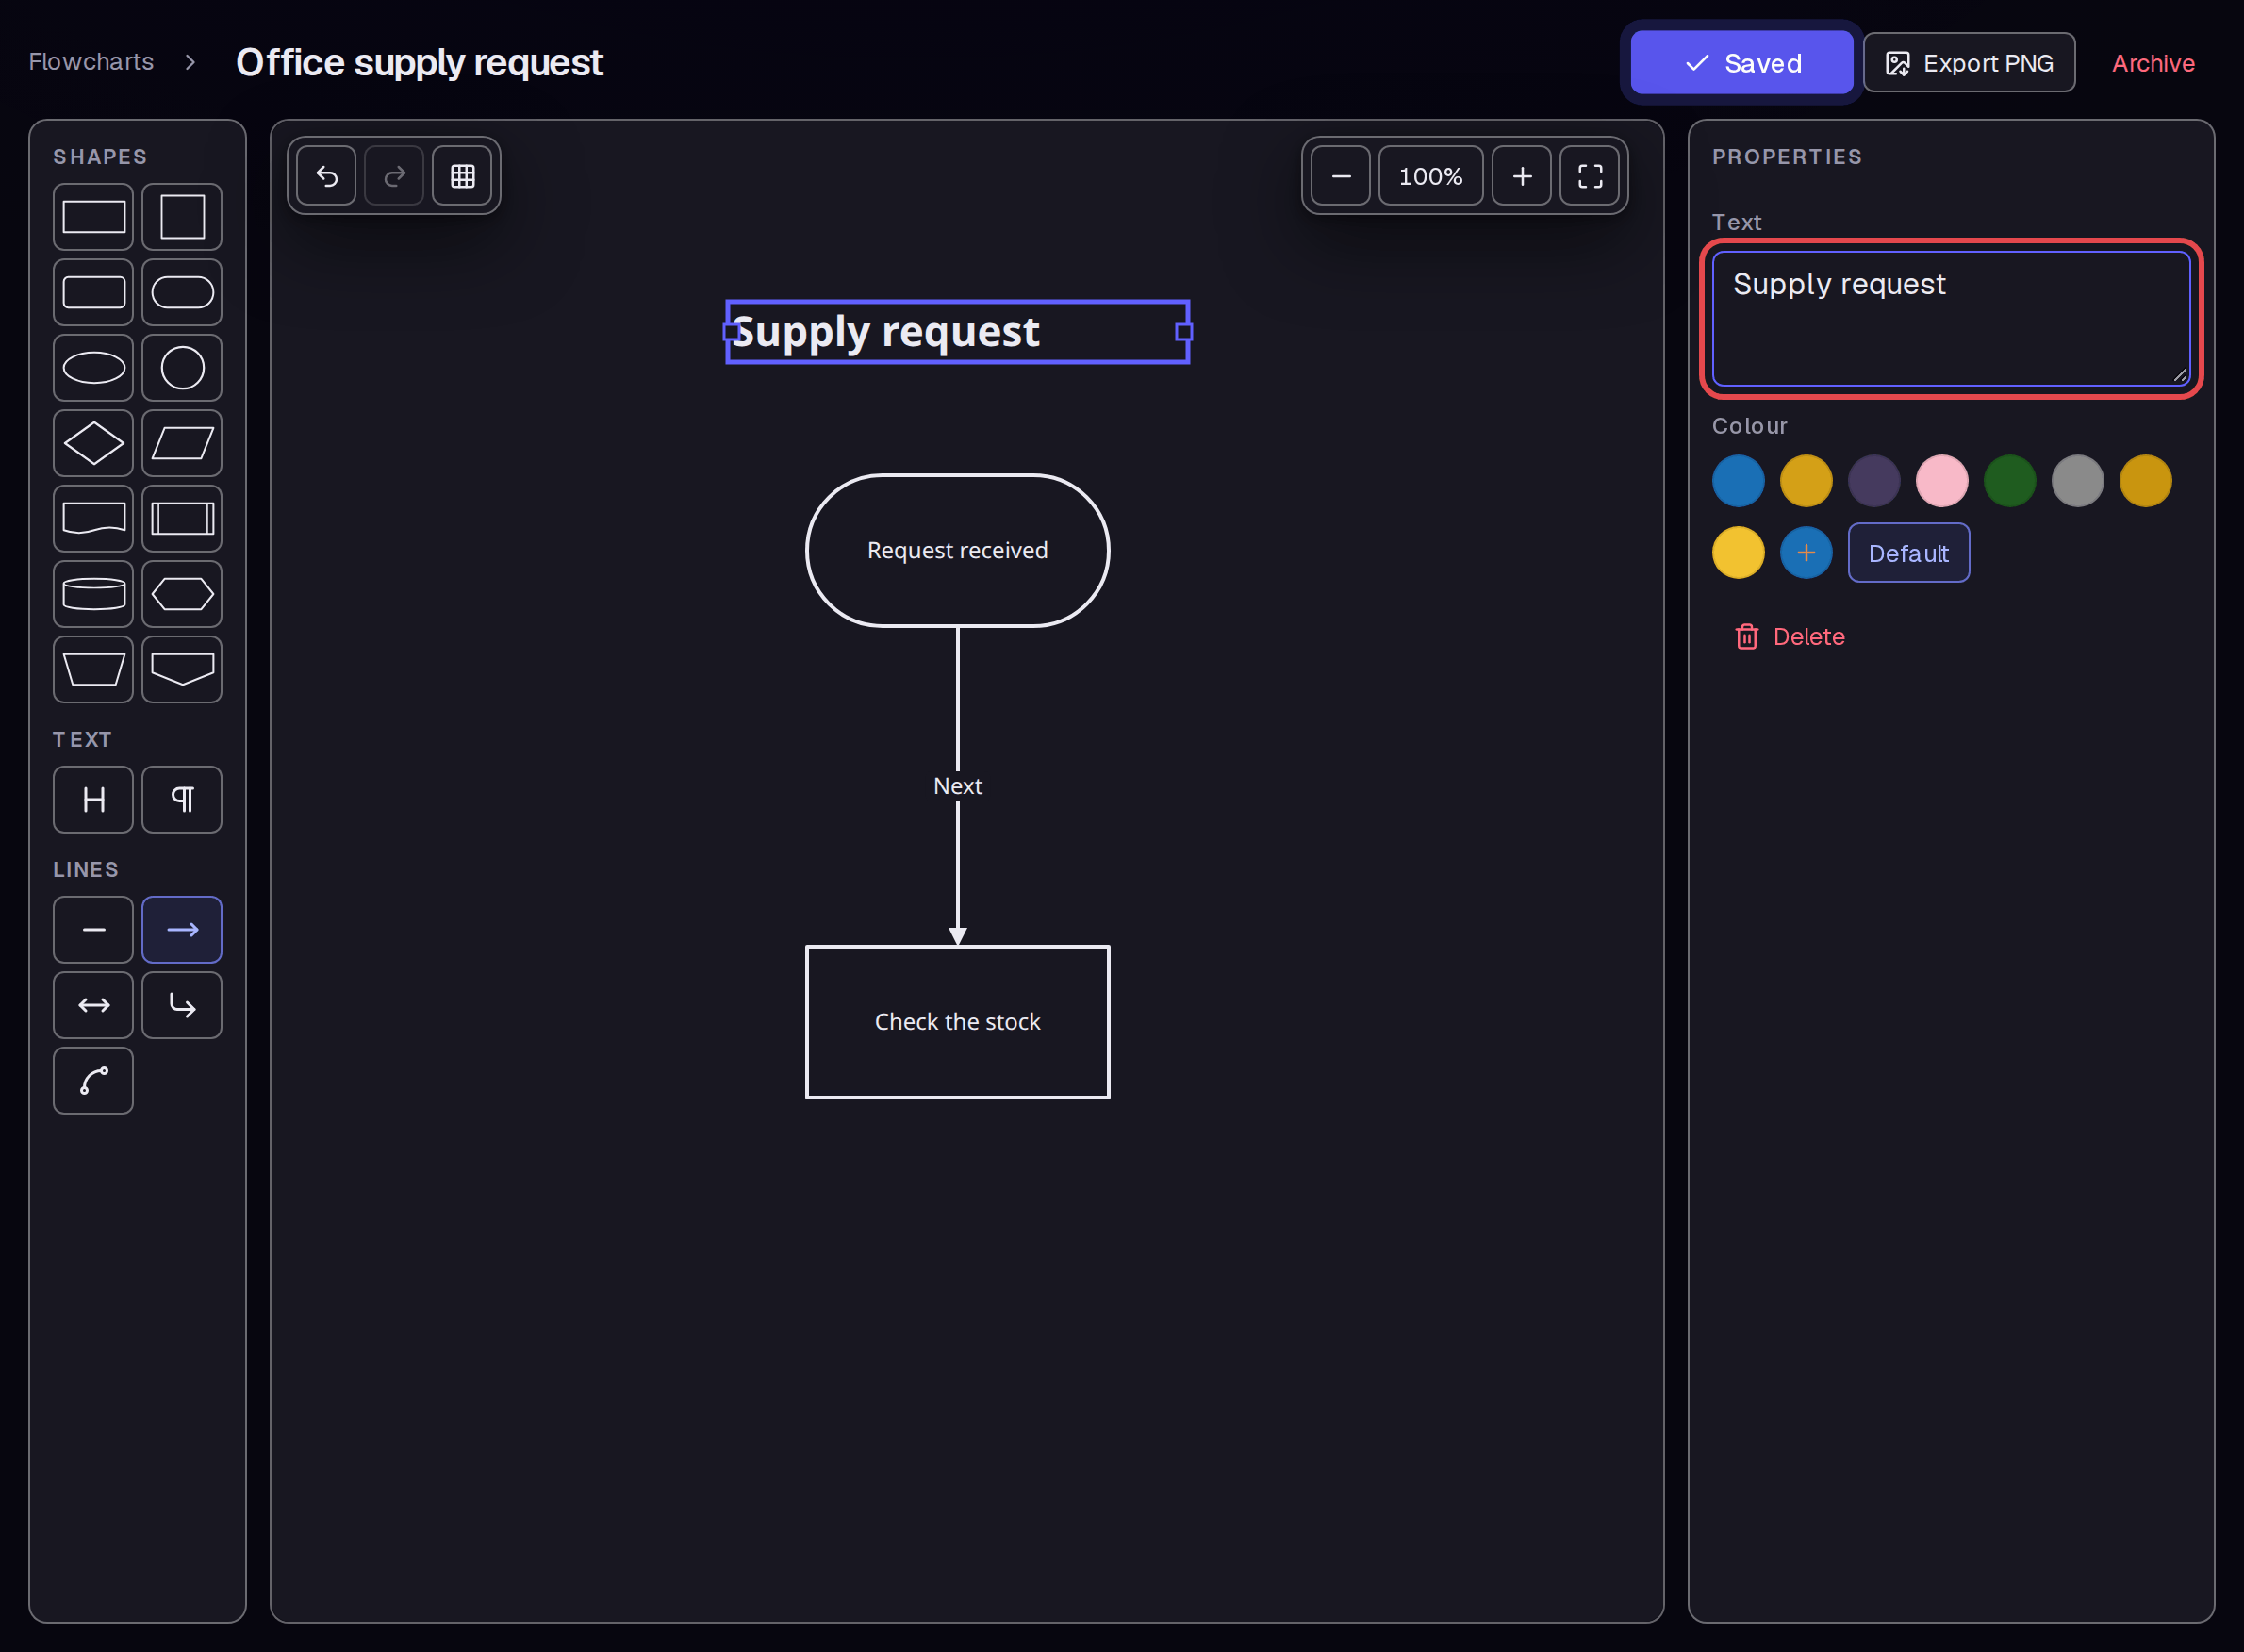
Click Title under TEXT. Replace the text in the right Text field with “Supply request.” Drag the heading above the start shape.
Step 6 — Change the zoom
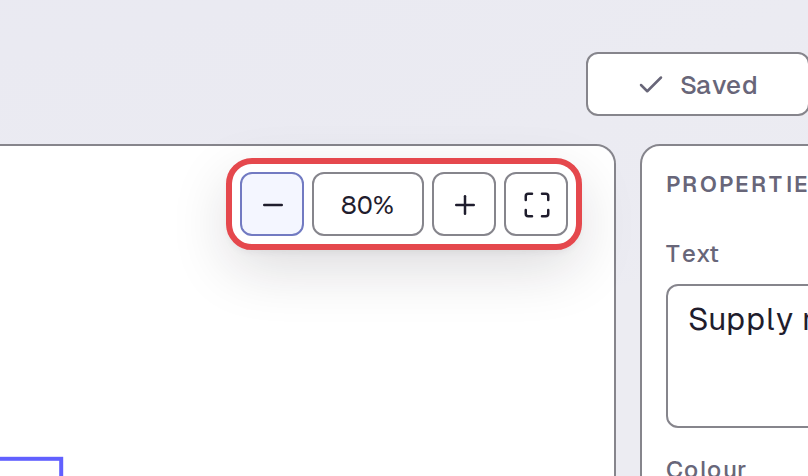
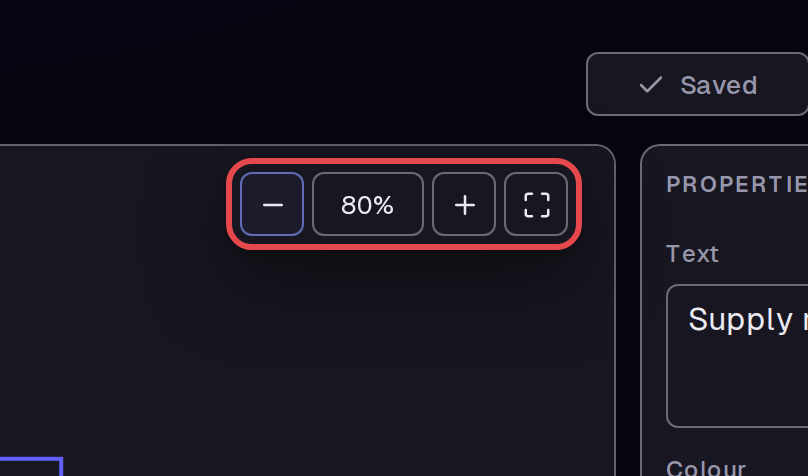
Click Zoom out, the minus button, twice to see a smaller view. The percentage changes to show the current zoom.
Step 7 — Fit the drawing to the screen
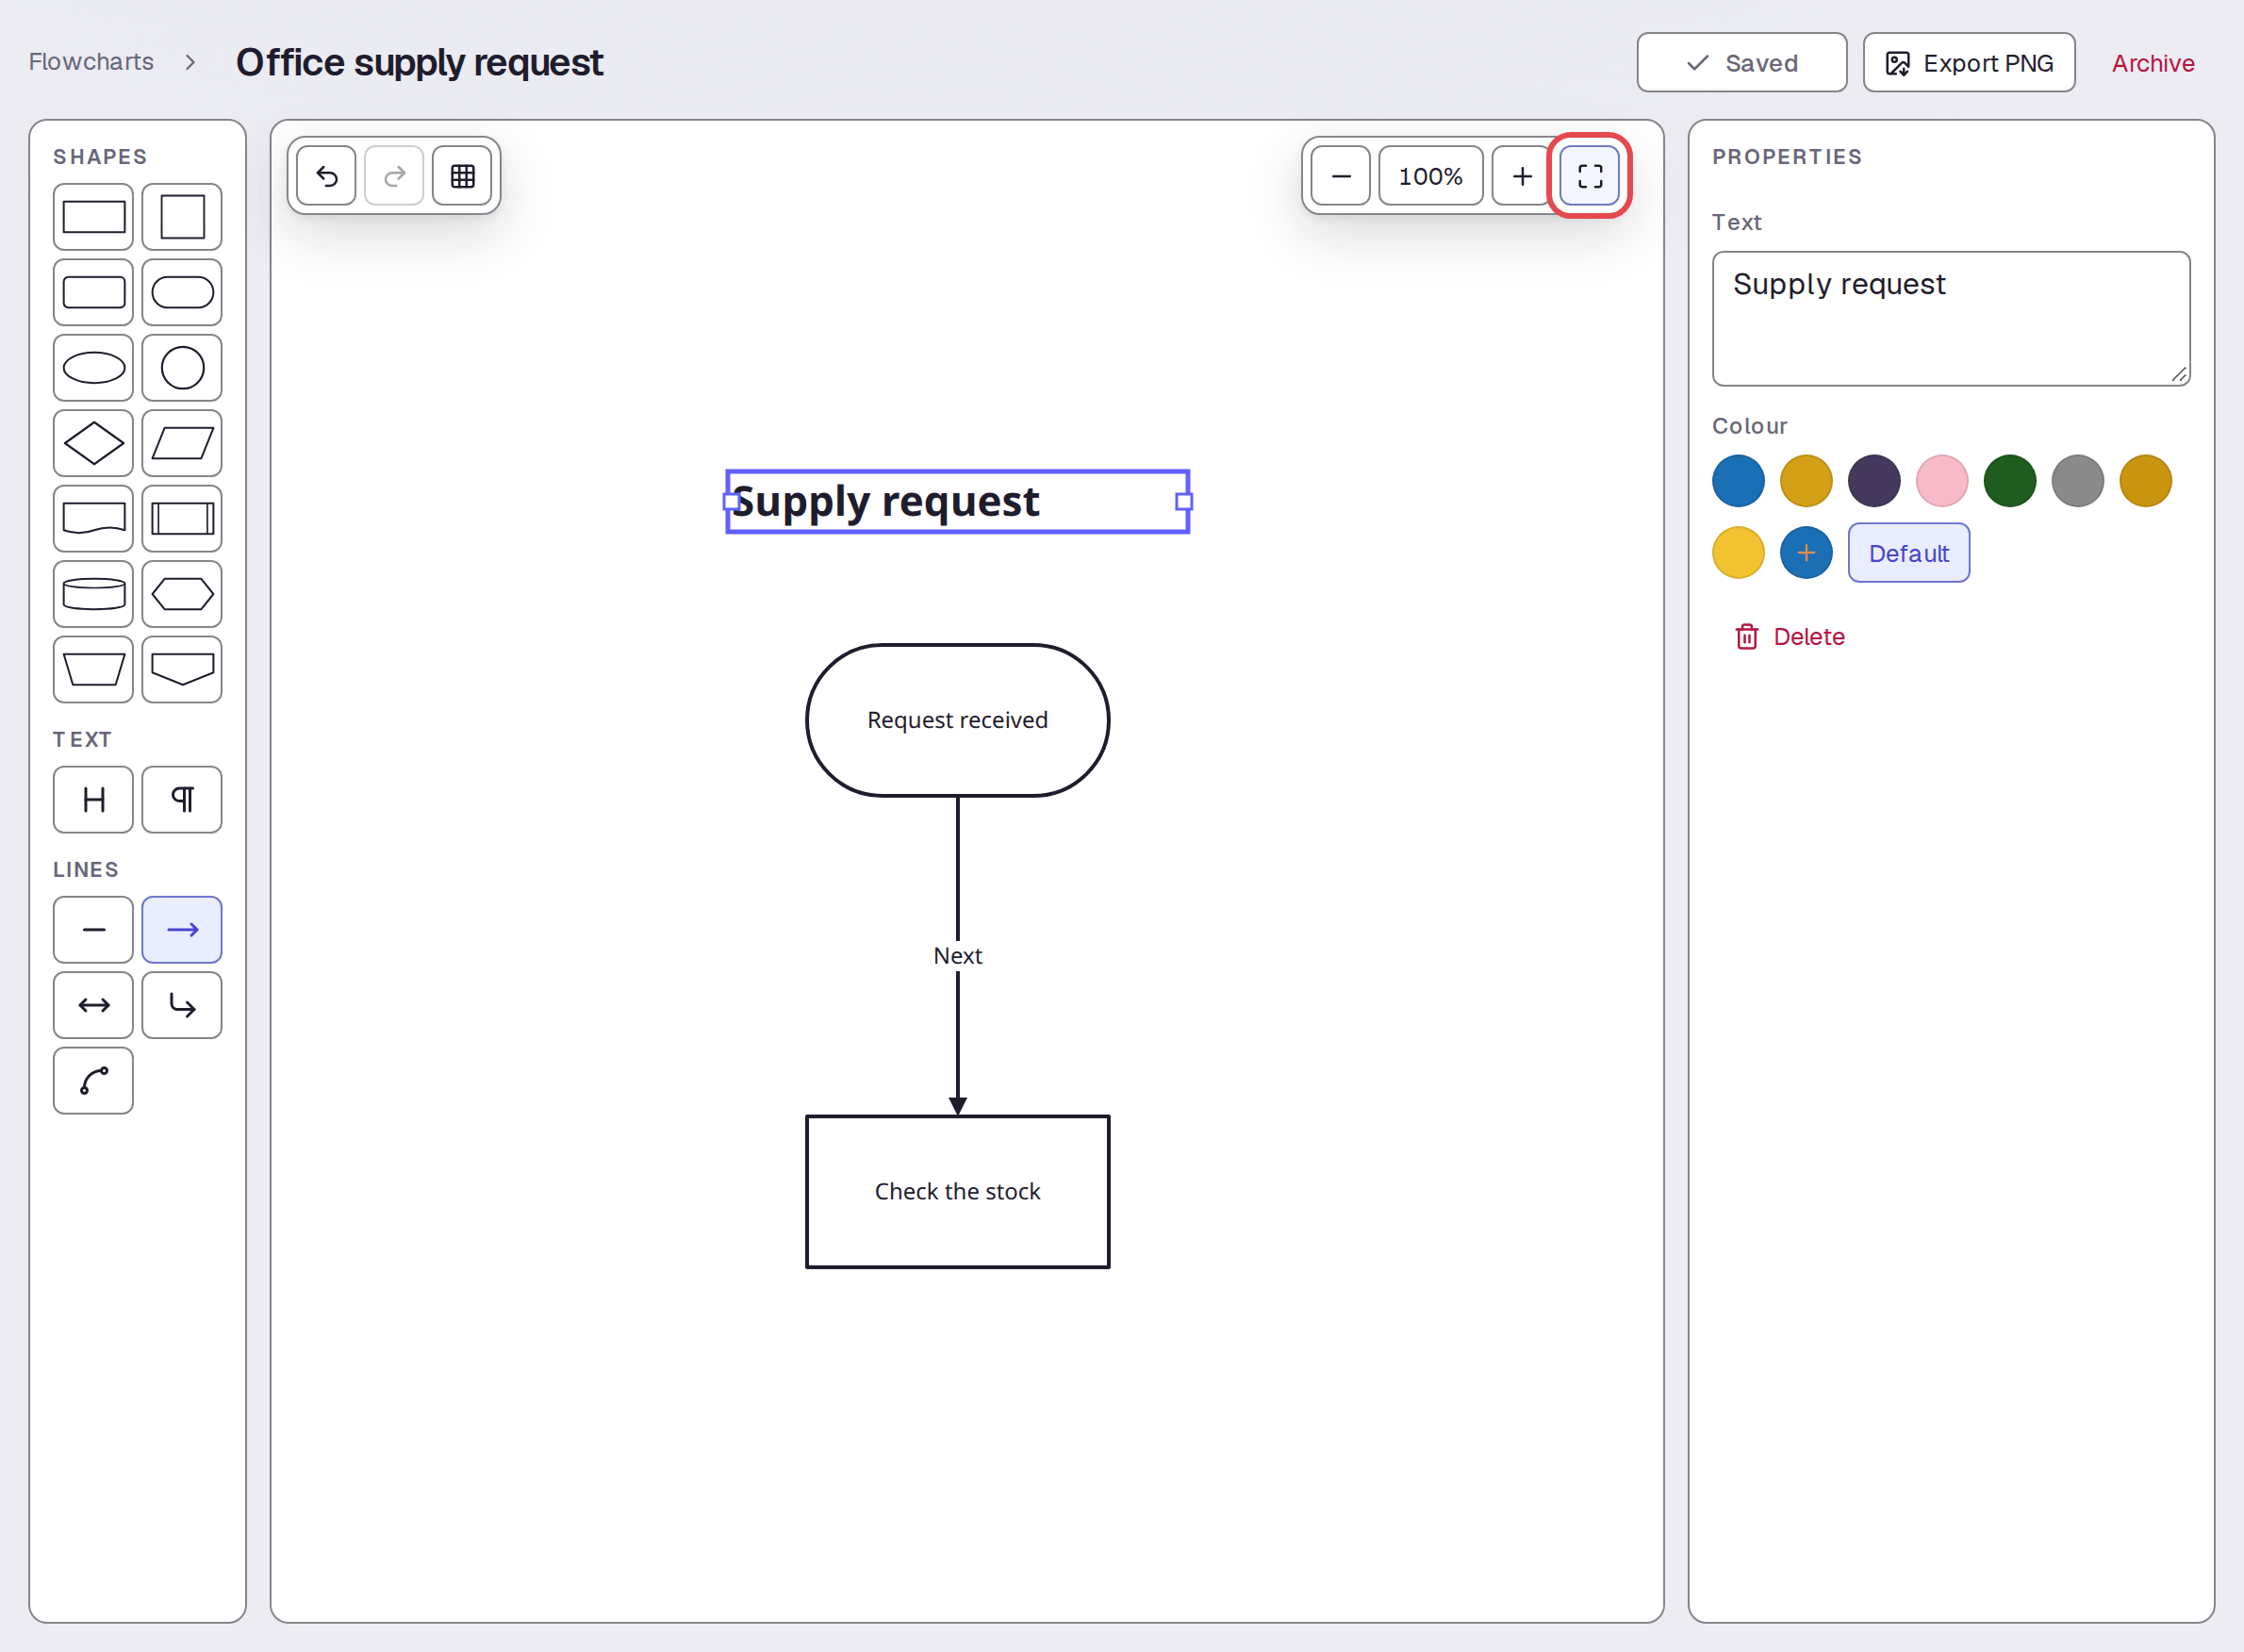
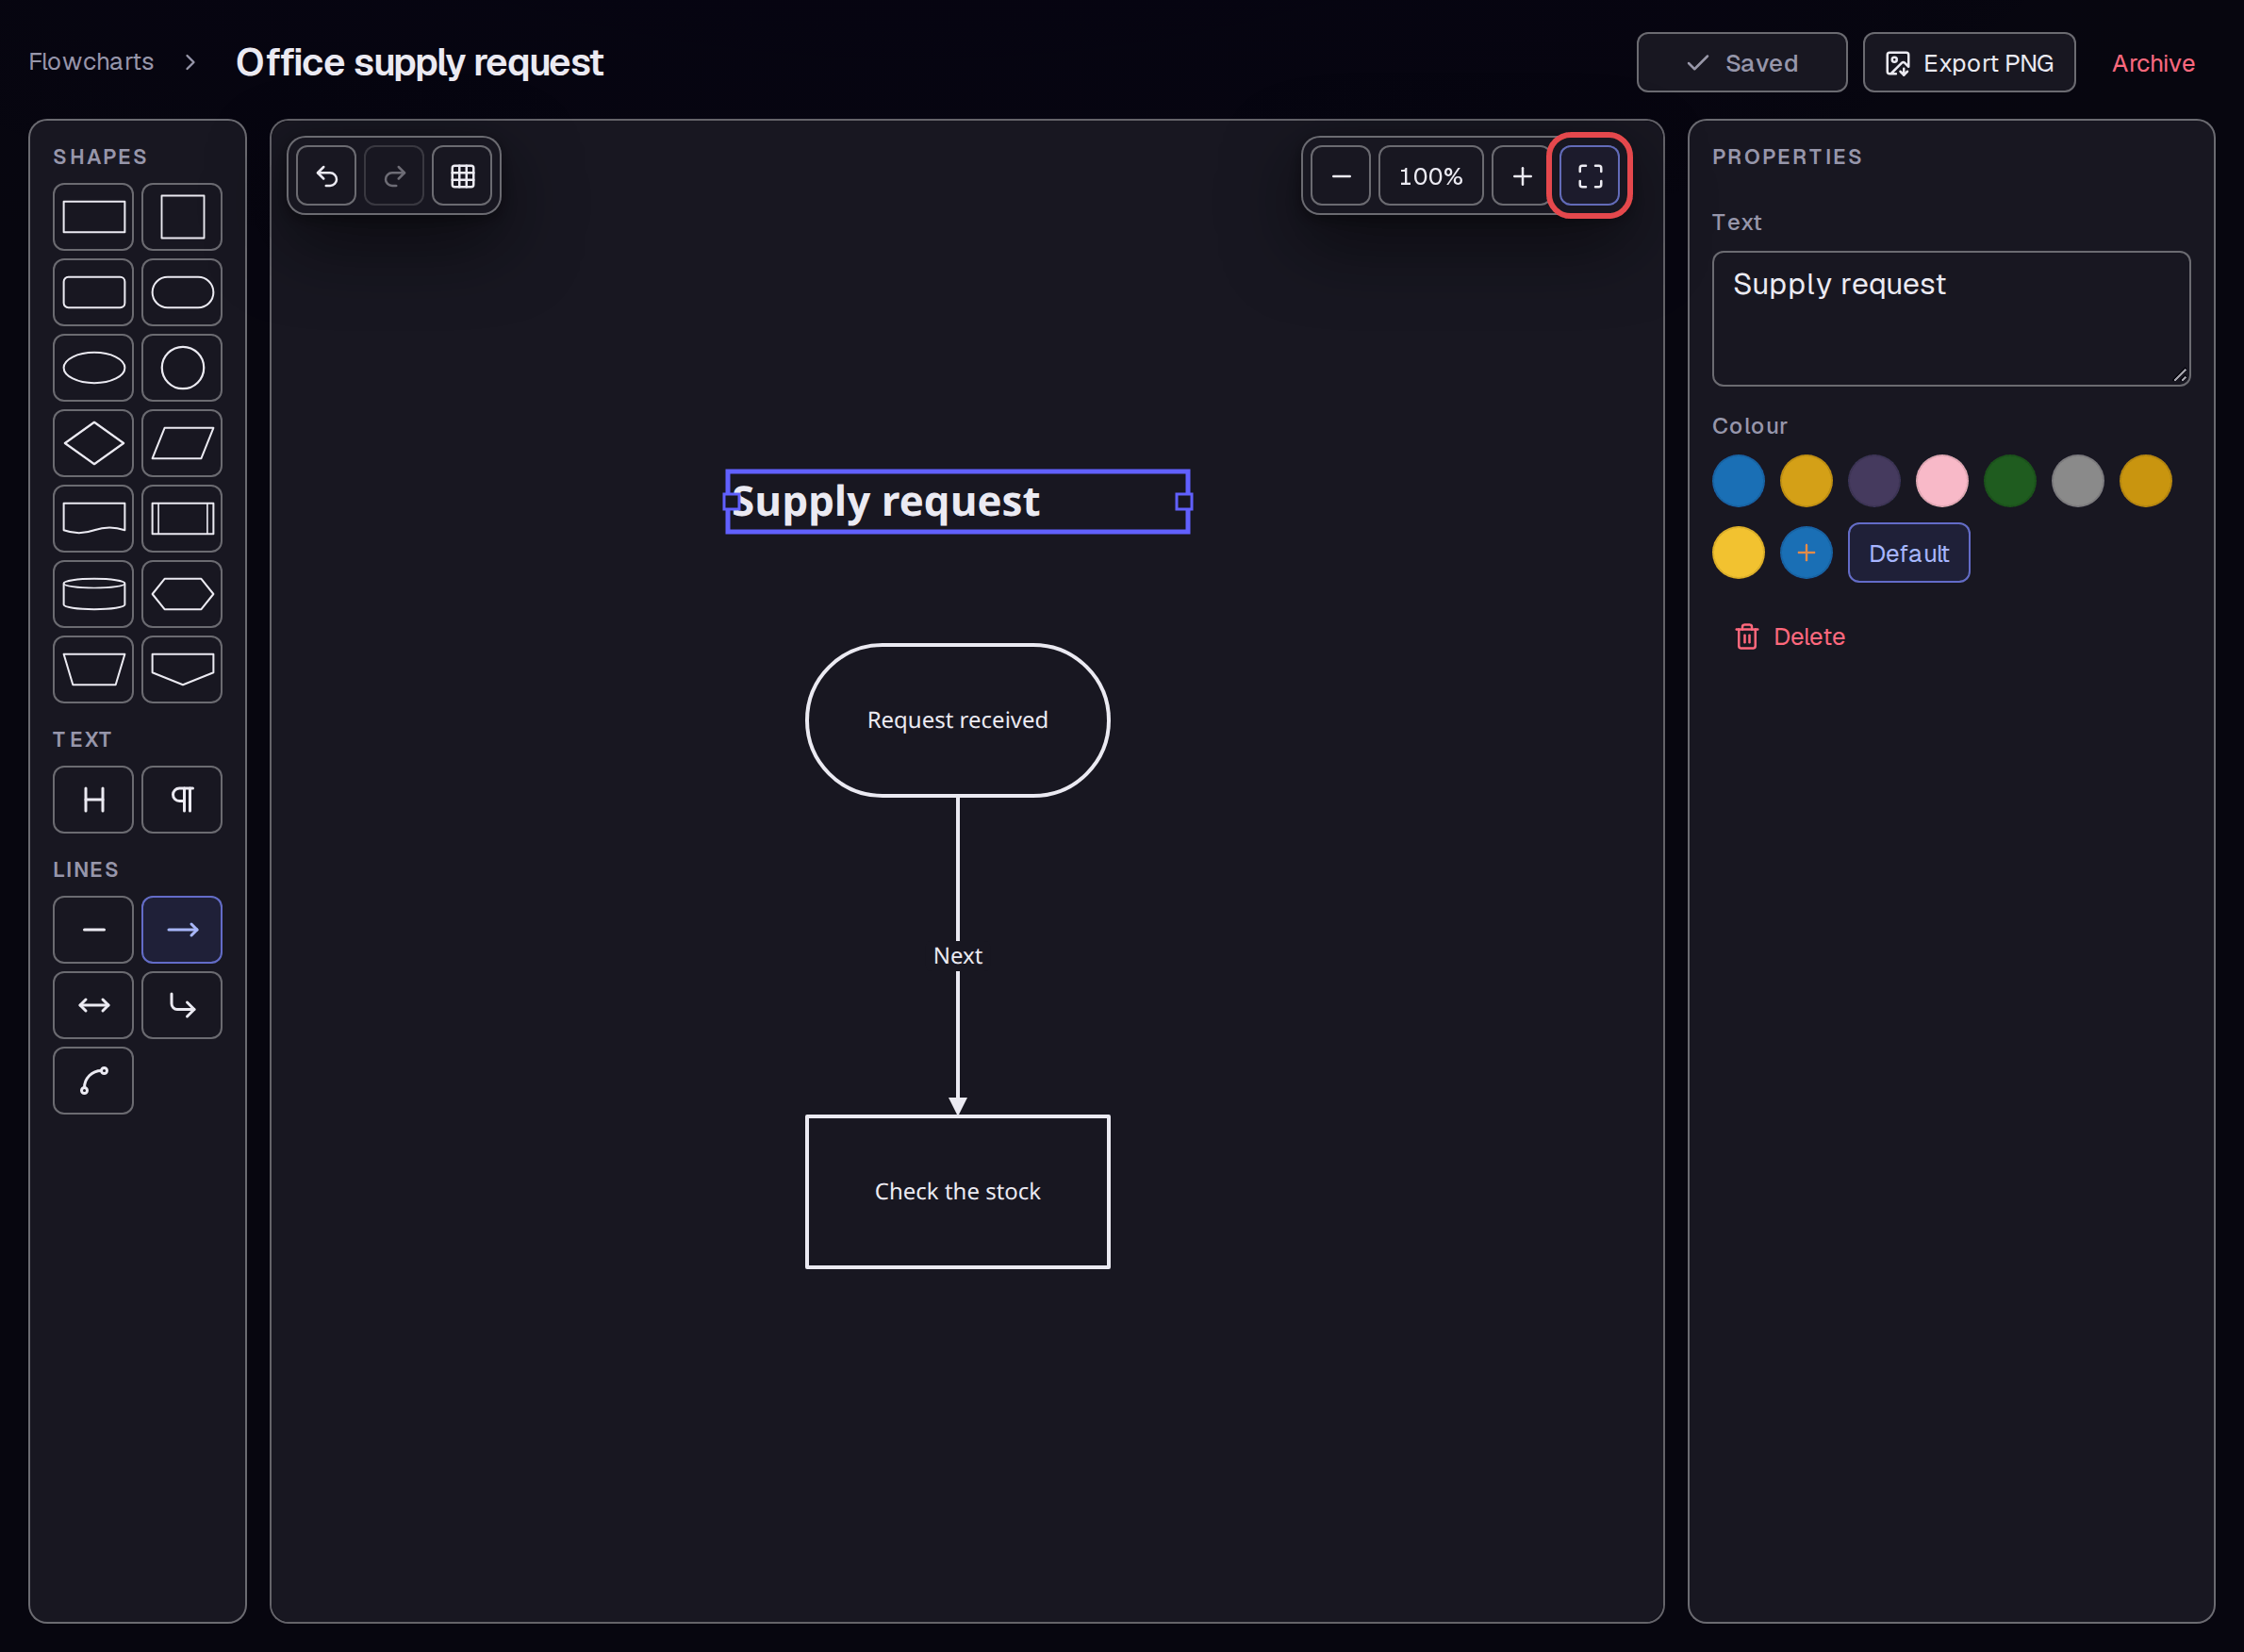
Click Fit to screen, the four-corner button beside the zoom controls. The drawing moves into view. Wait until the top status shows Saved before you leave.
Step 8 — Export a PNG
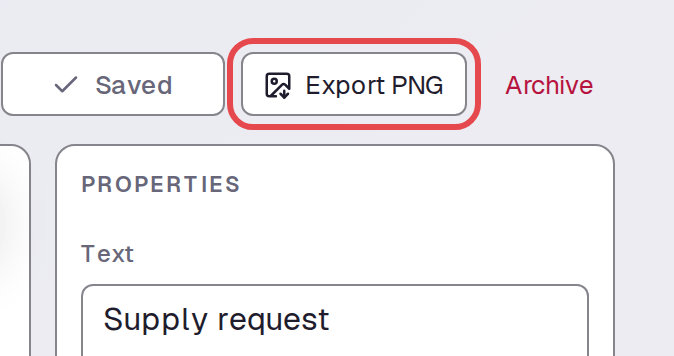
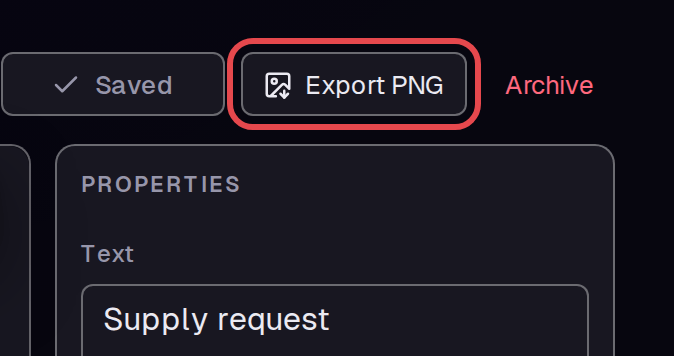
Click Export PNG at the top. The browser downloads a PNG image of the flowchart.
Tips
- Select an arrow to change its Label in PROPERTIES.
- Select a shape to change its Text.
- The editor saves changes and shows Saved when they are saved.
- Export PNG downloads an image of the drawing.
What next
Turn the actions into a checklist and tasks, or build a training course.